| Image | Title | Source / Methodology |
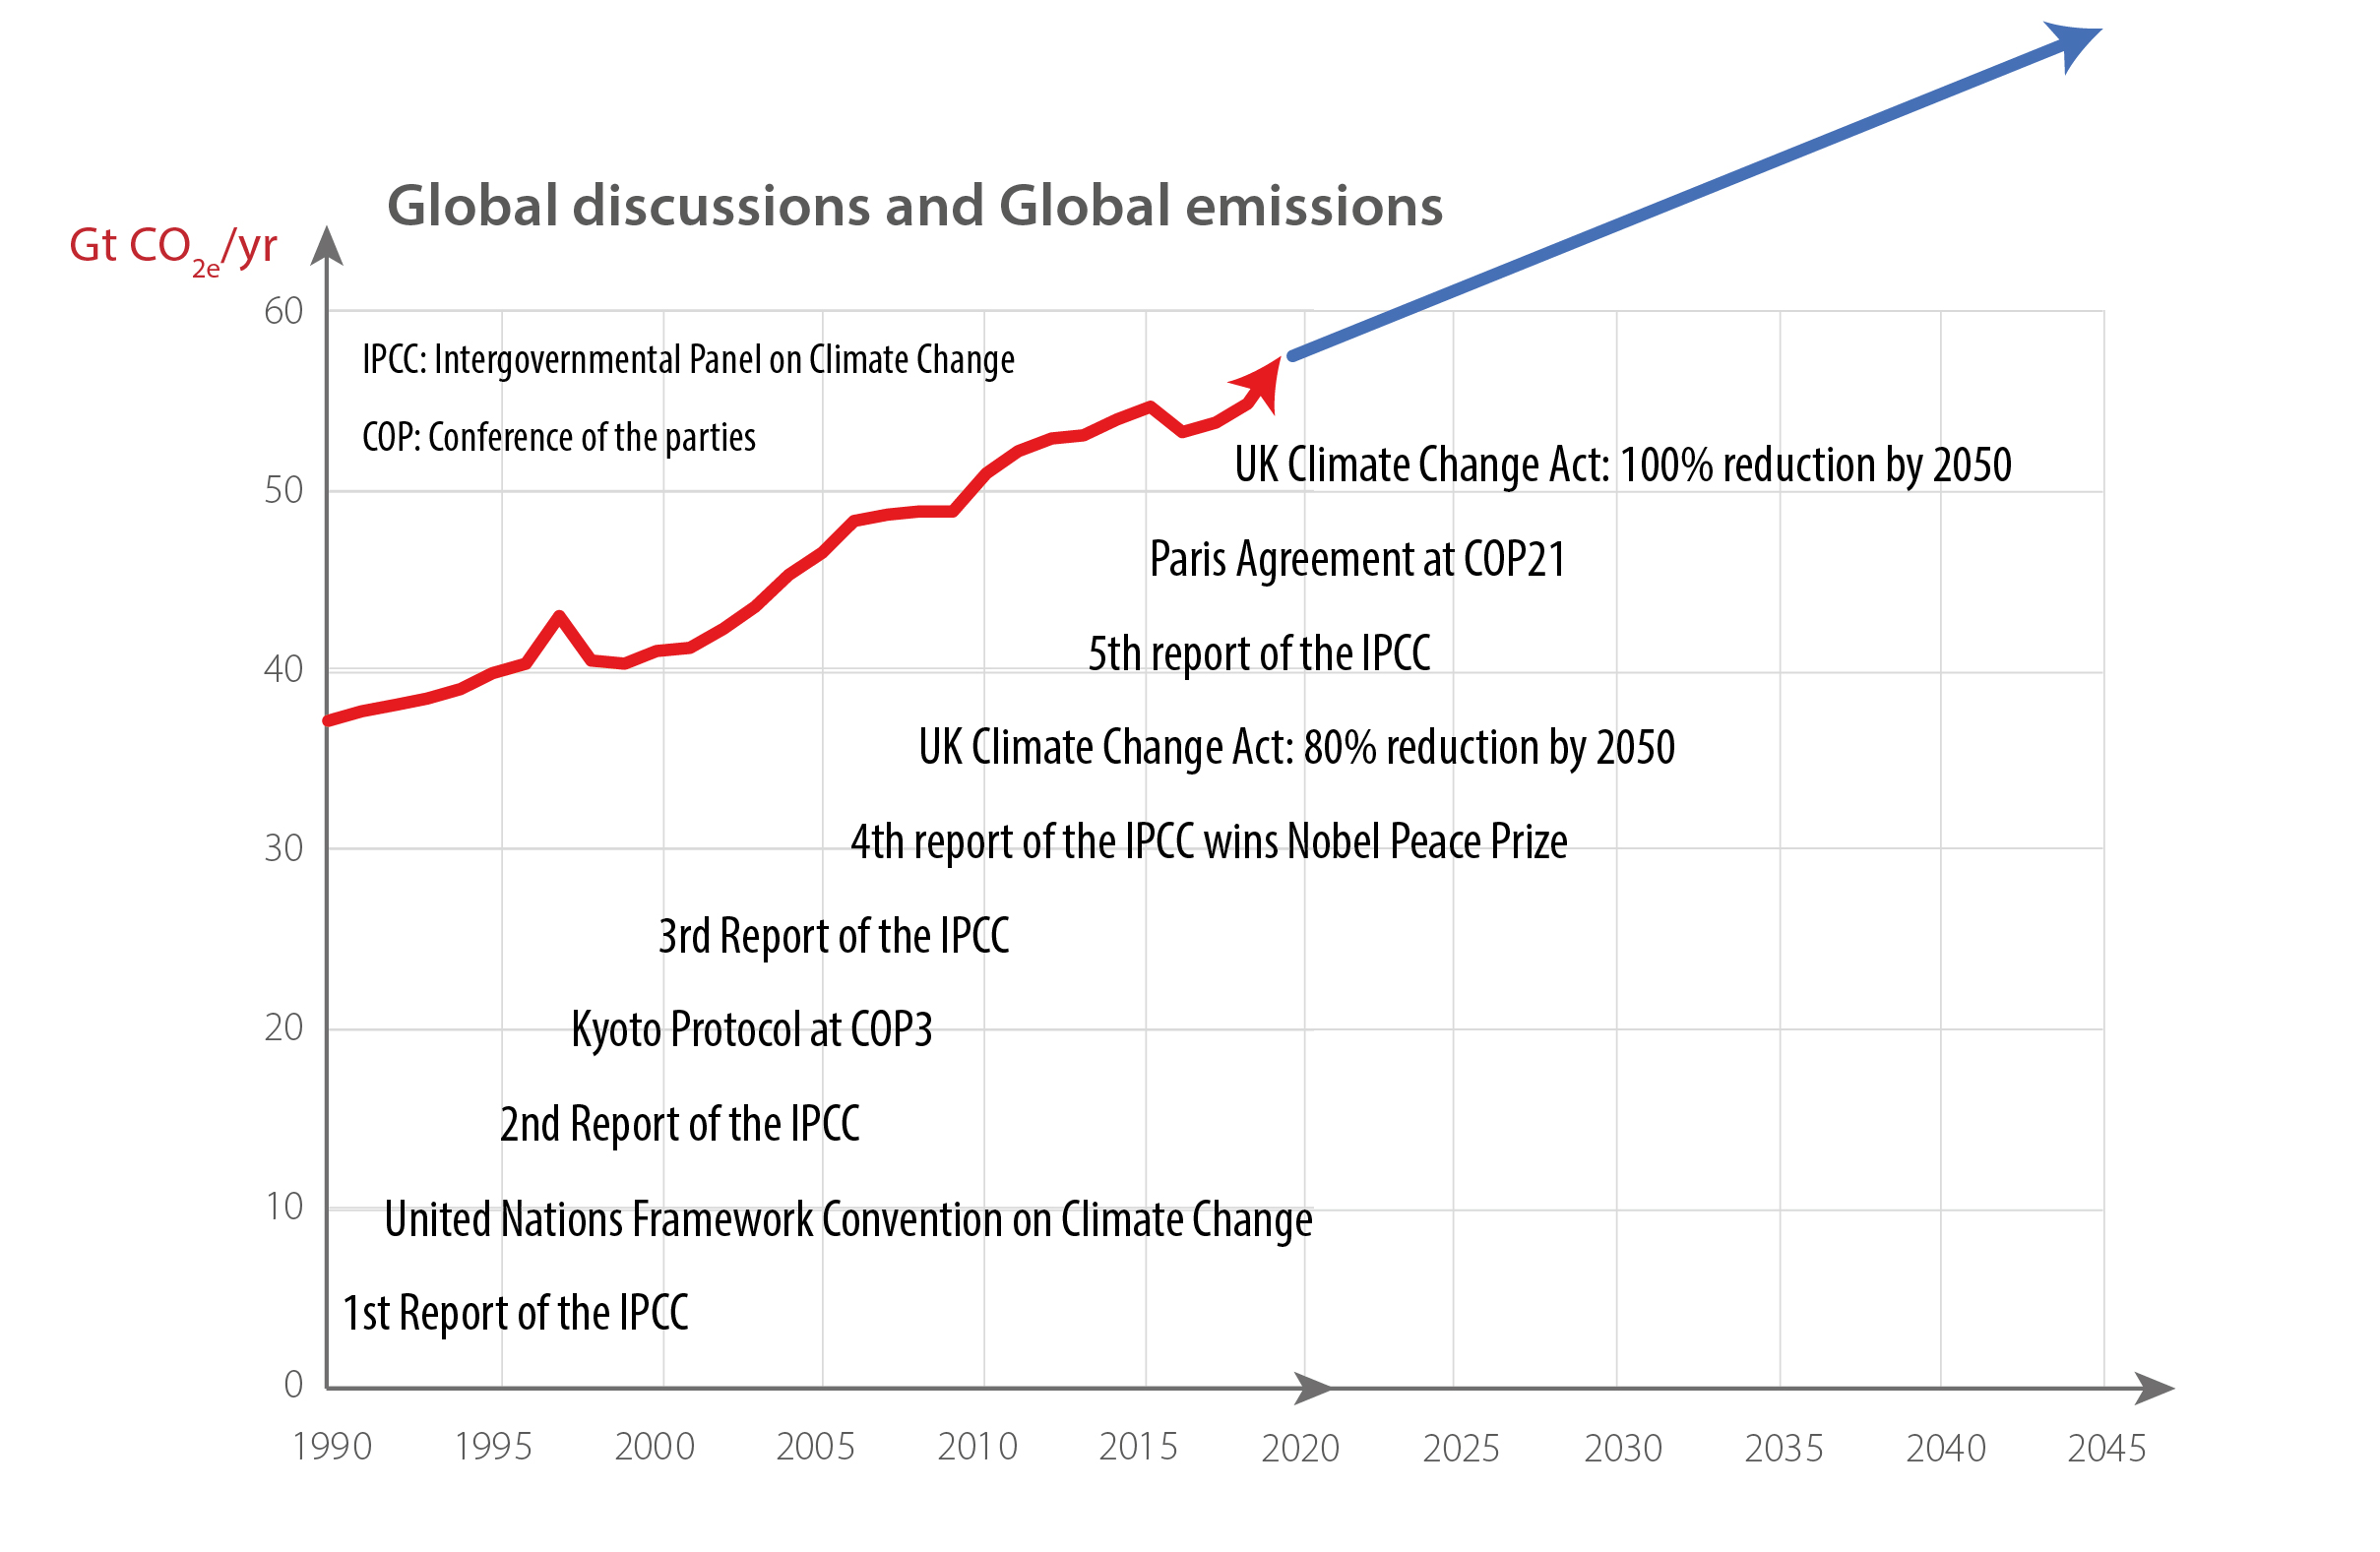 | Rising emissions over time | TRENDS IN GLOBAL CO2 AND TOTAL GREENHOUSE GAS EMISSIONS, PBL Netherlands Environment Assessment Agency, 2019, J.G.J. Olivier and J.A.H.W. Peters |
 | Remaining capacity in tank | Warming caused by cumulative carbon emissions towards the trillionth tonne, Nature Myles R. Allen, David J. Frame, Chris Huntingford, Chris D. |
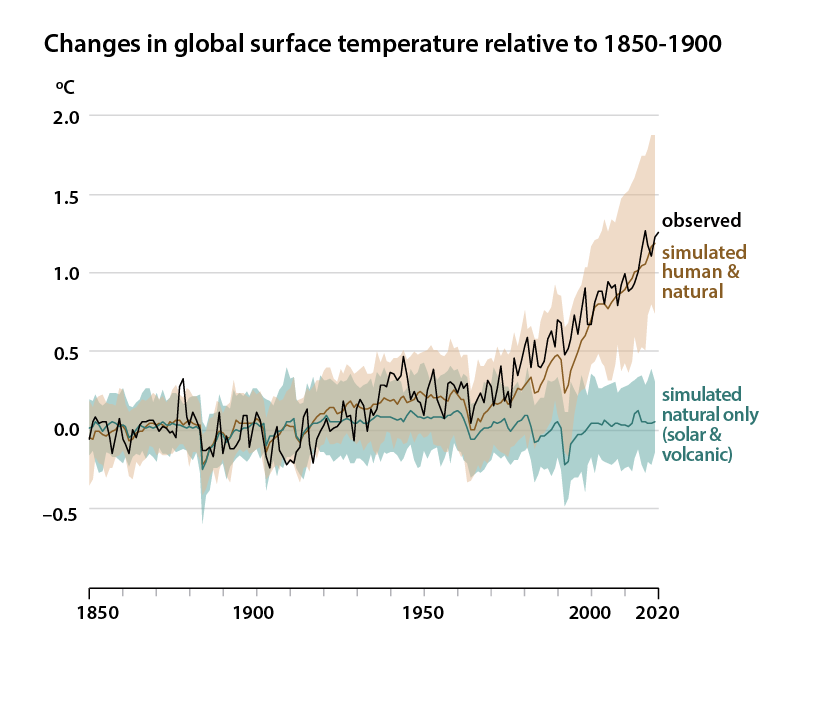 | Global temperatures | Data source: IPCC Working Group 1 6th Assessment report |
 | Indicators of the effects of climate change | Data source: IPCC Working Group 2 6th Assessment report |
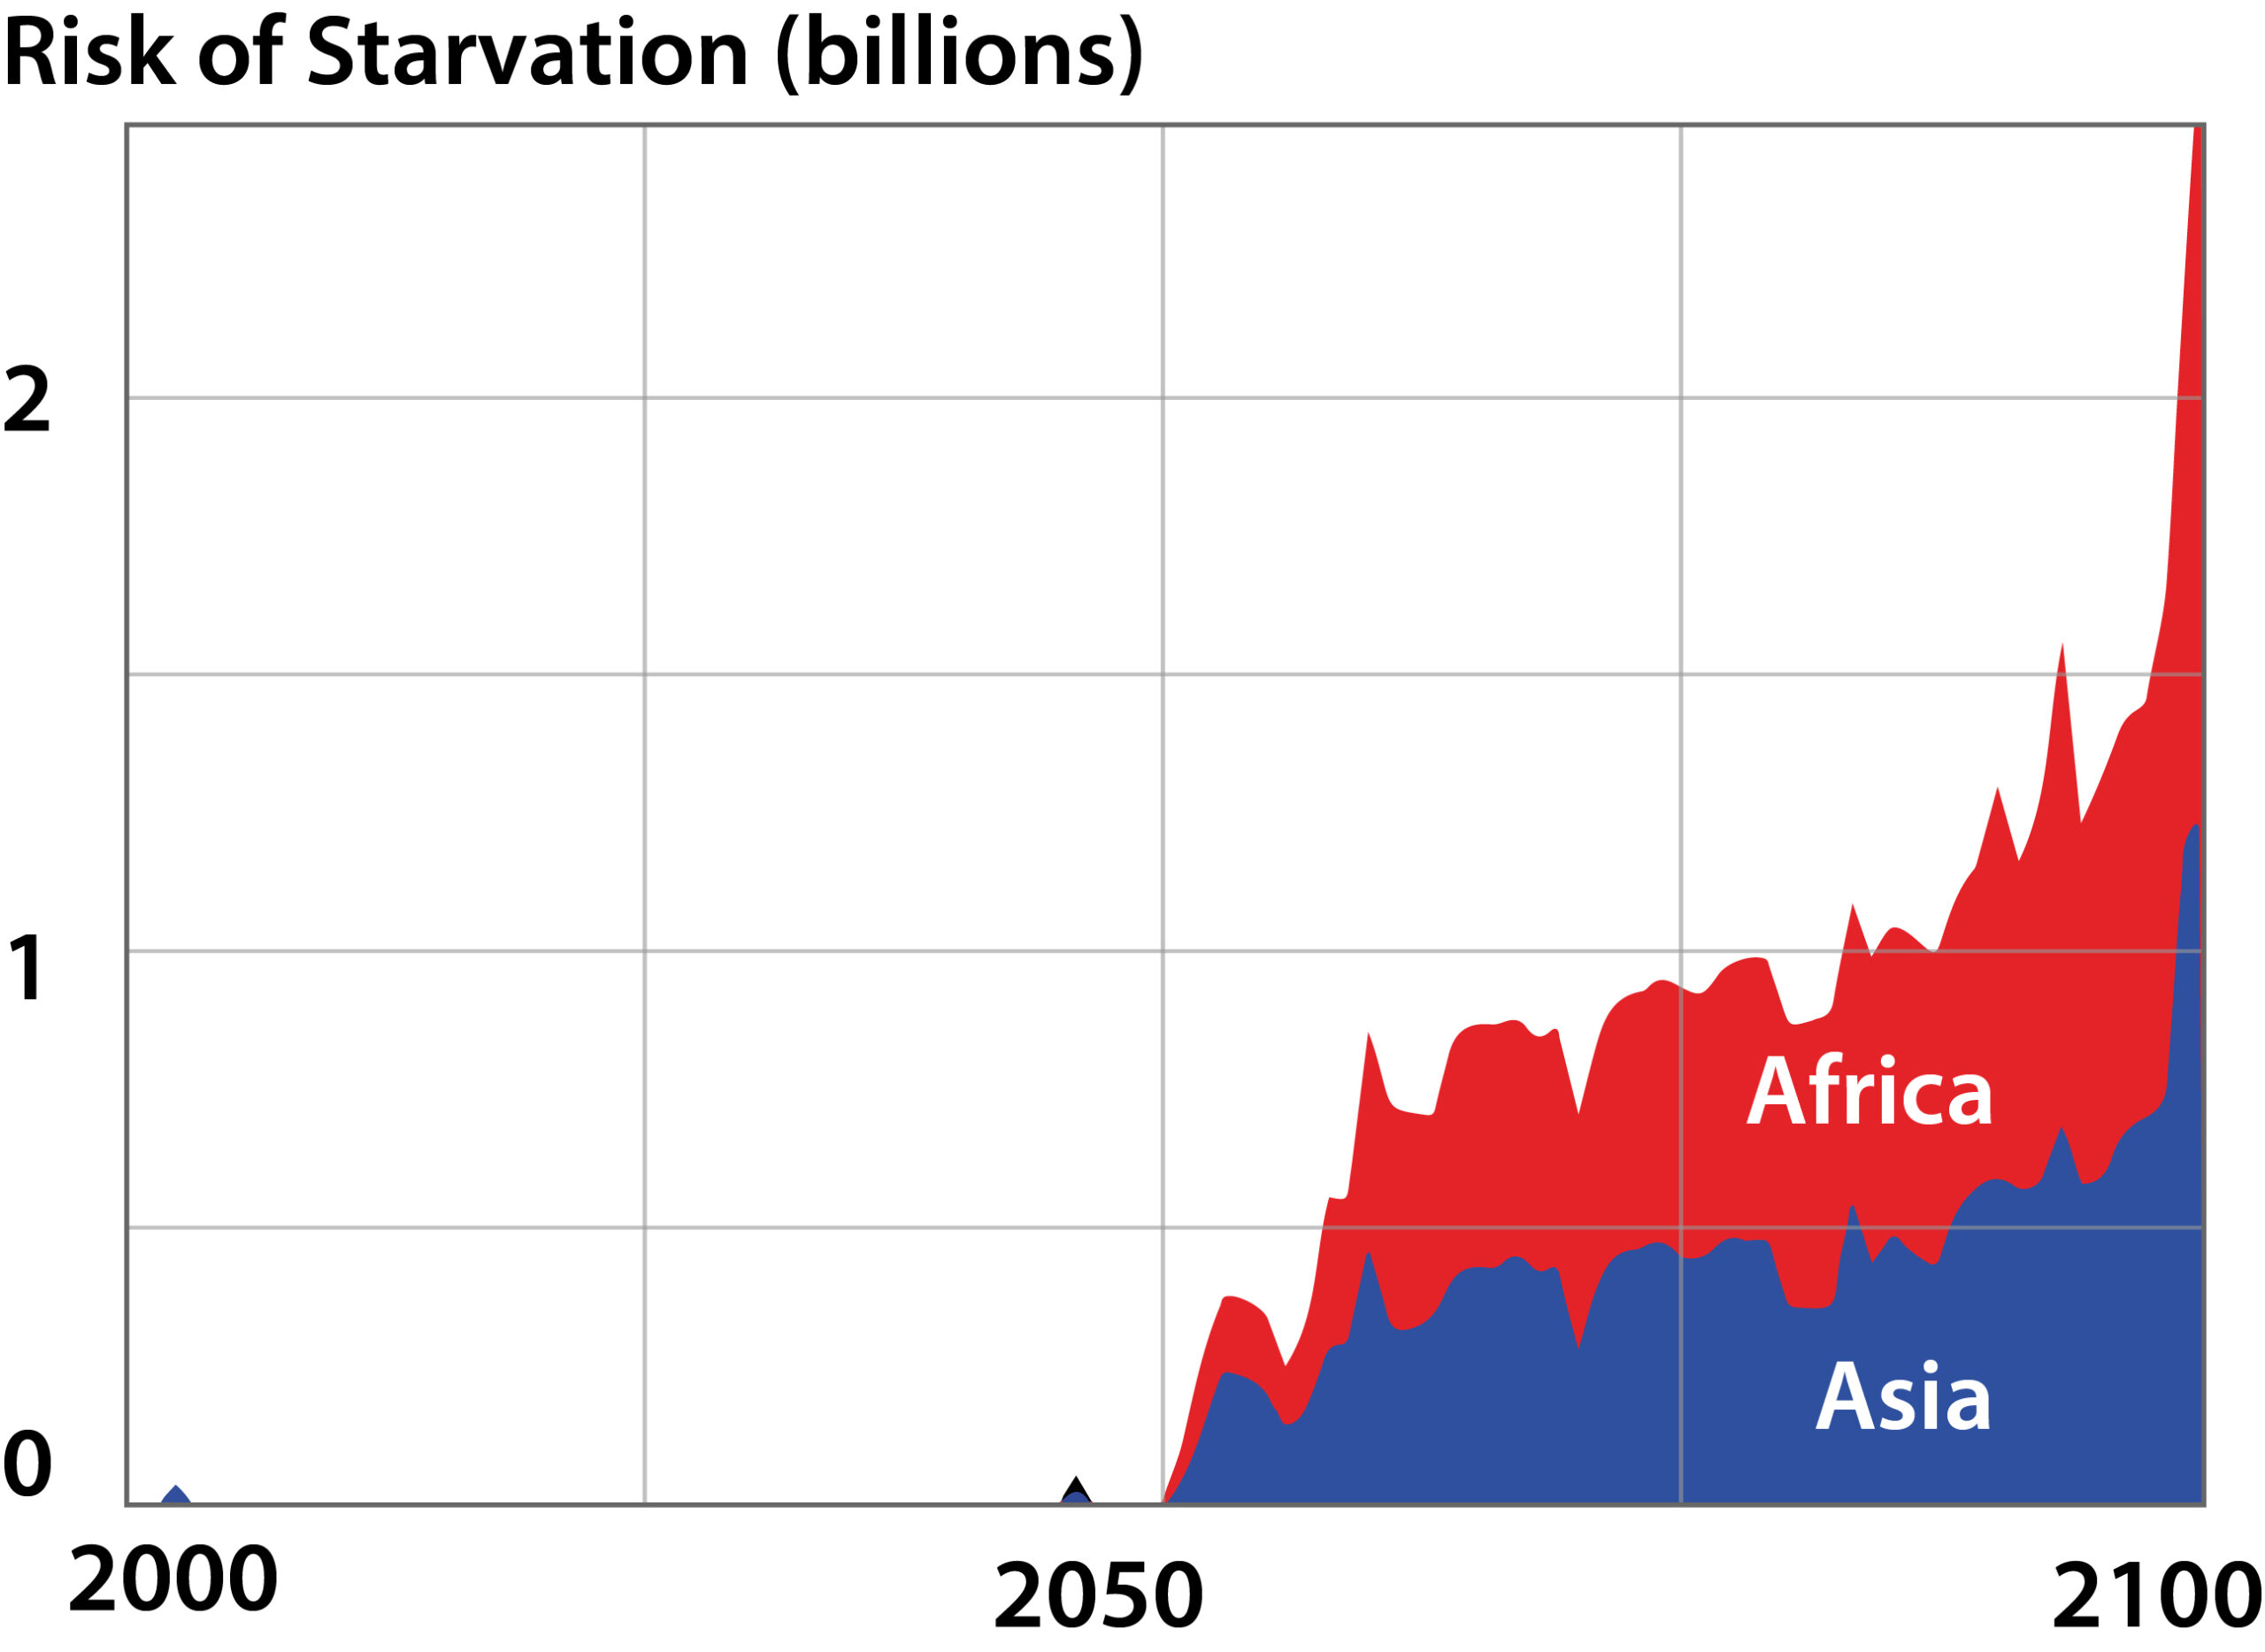 | Risk of starvation | Richards, C.E., Gauch, H. and Allwood, J.M. (2022) “Influence of climate policy and socioeconomic development on the risk of starvation”, under review, Global Environmental Change |
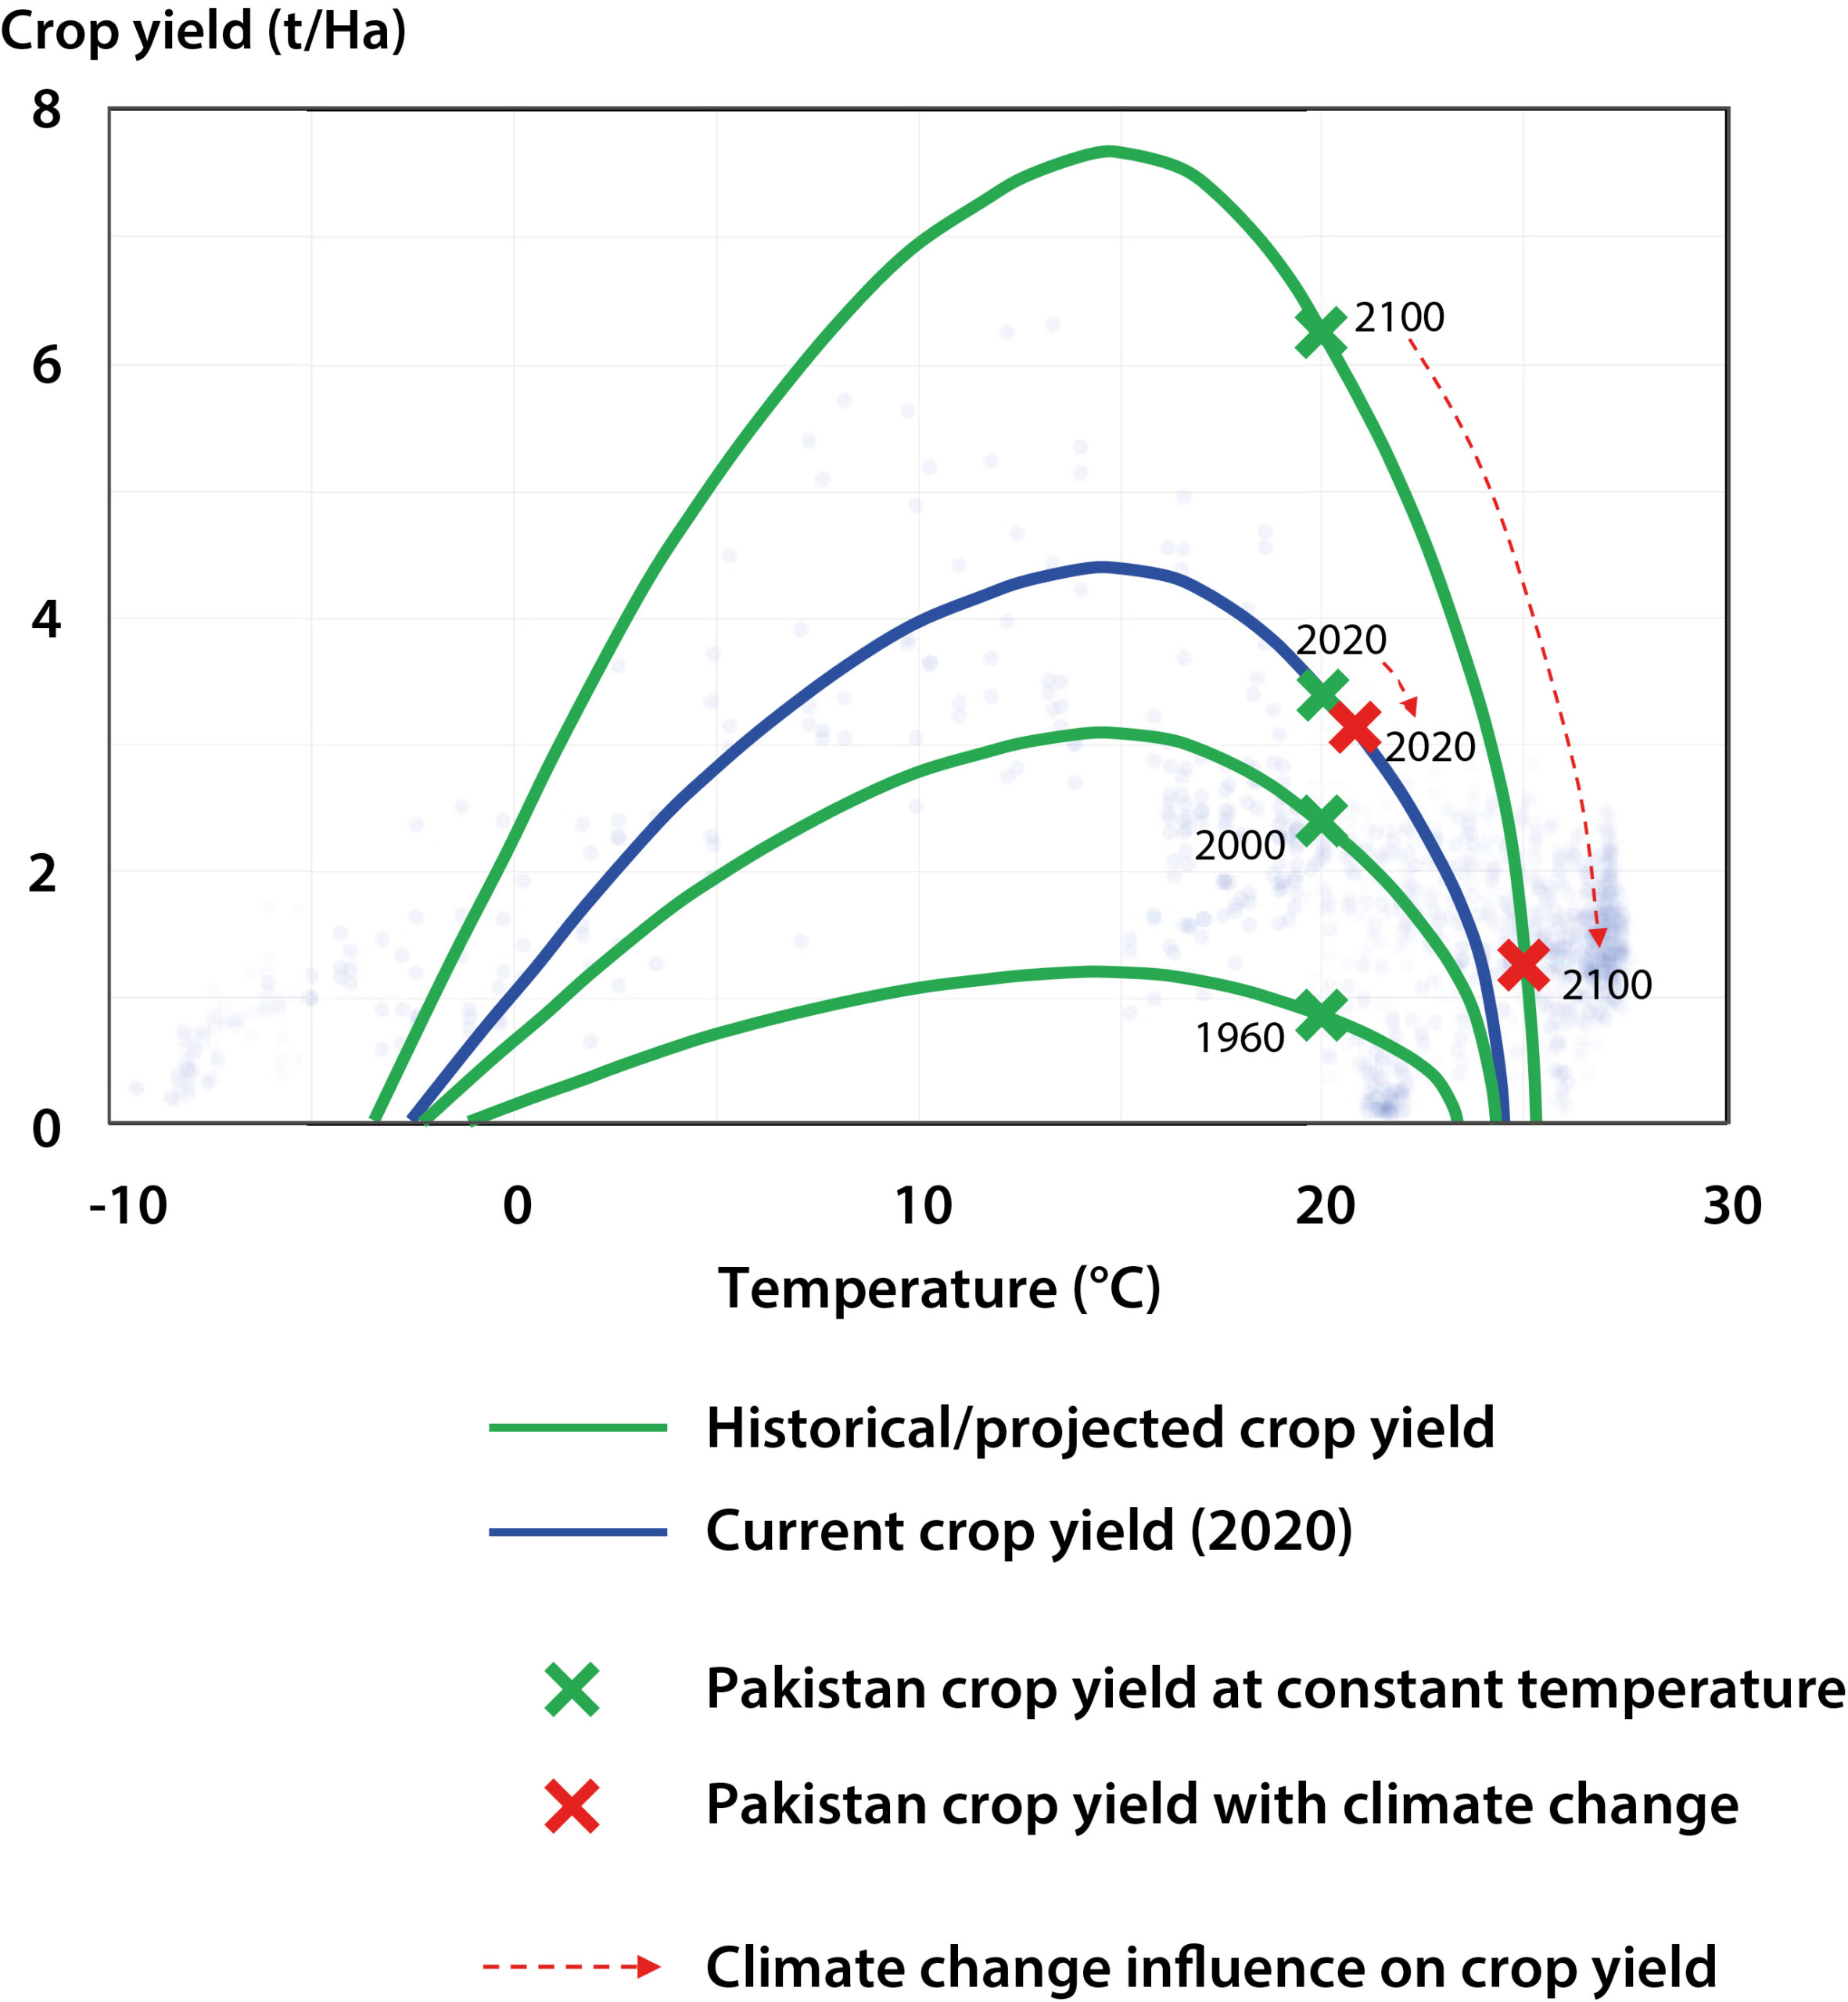 | Crop yields | Richards, C.E., Gauch, H. and Allwood, J.M. (2022) “Influence of climate policy and socioeconomic development on the risk of starvation”, under review, Global Environmental Change |
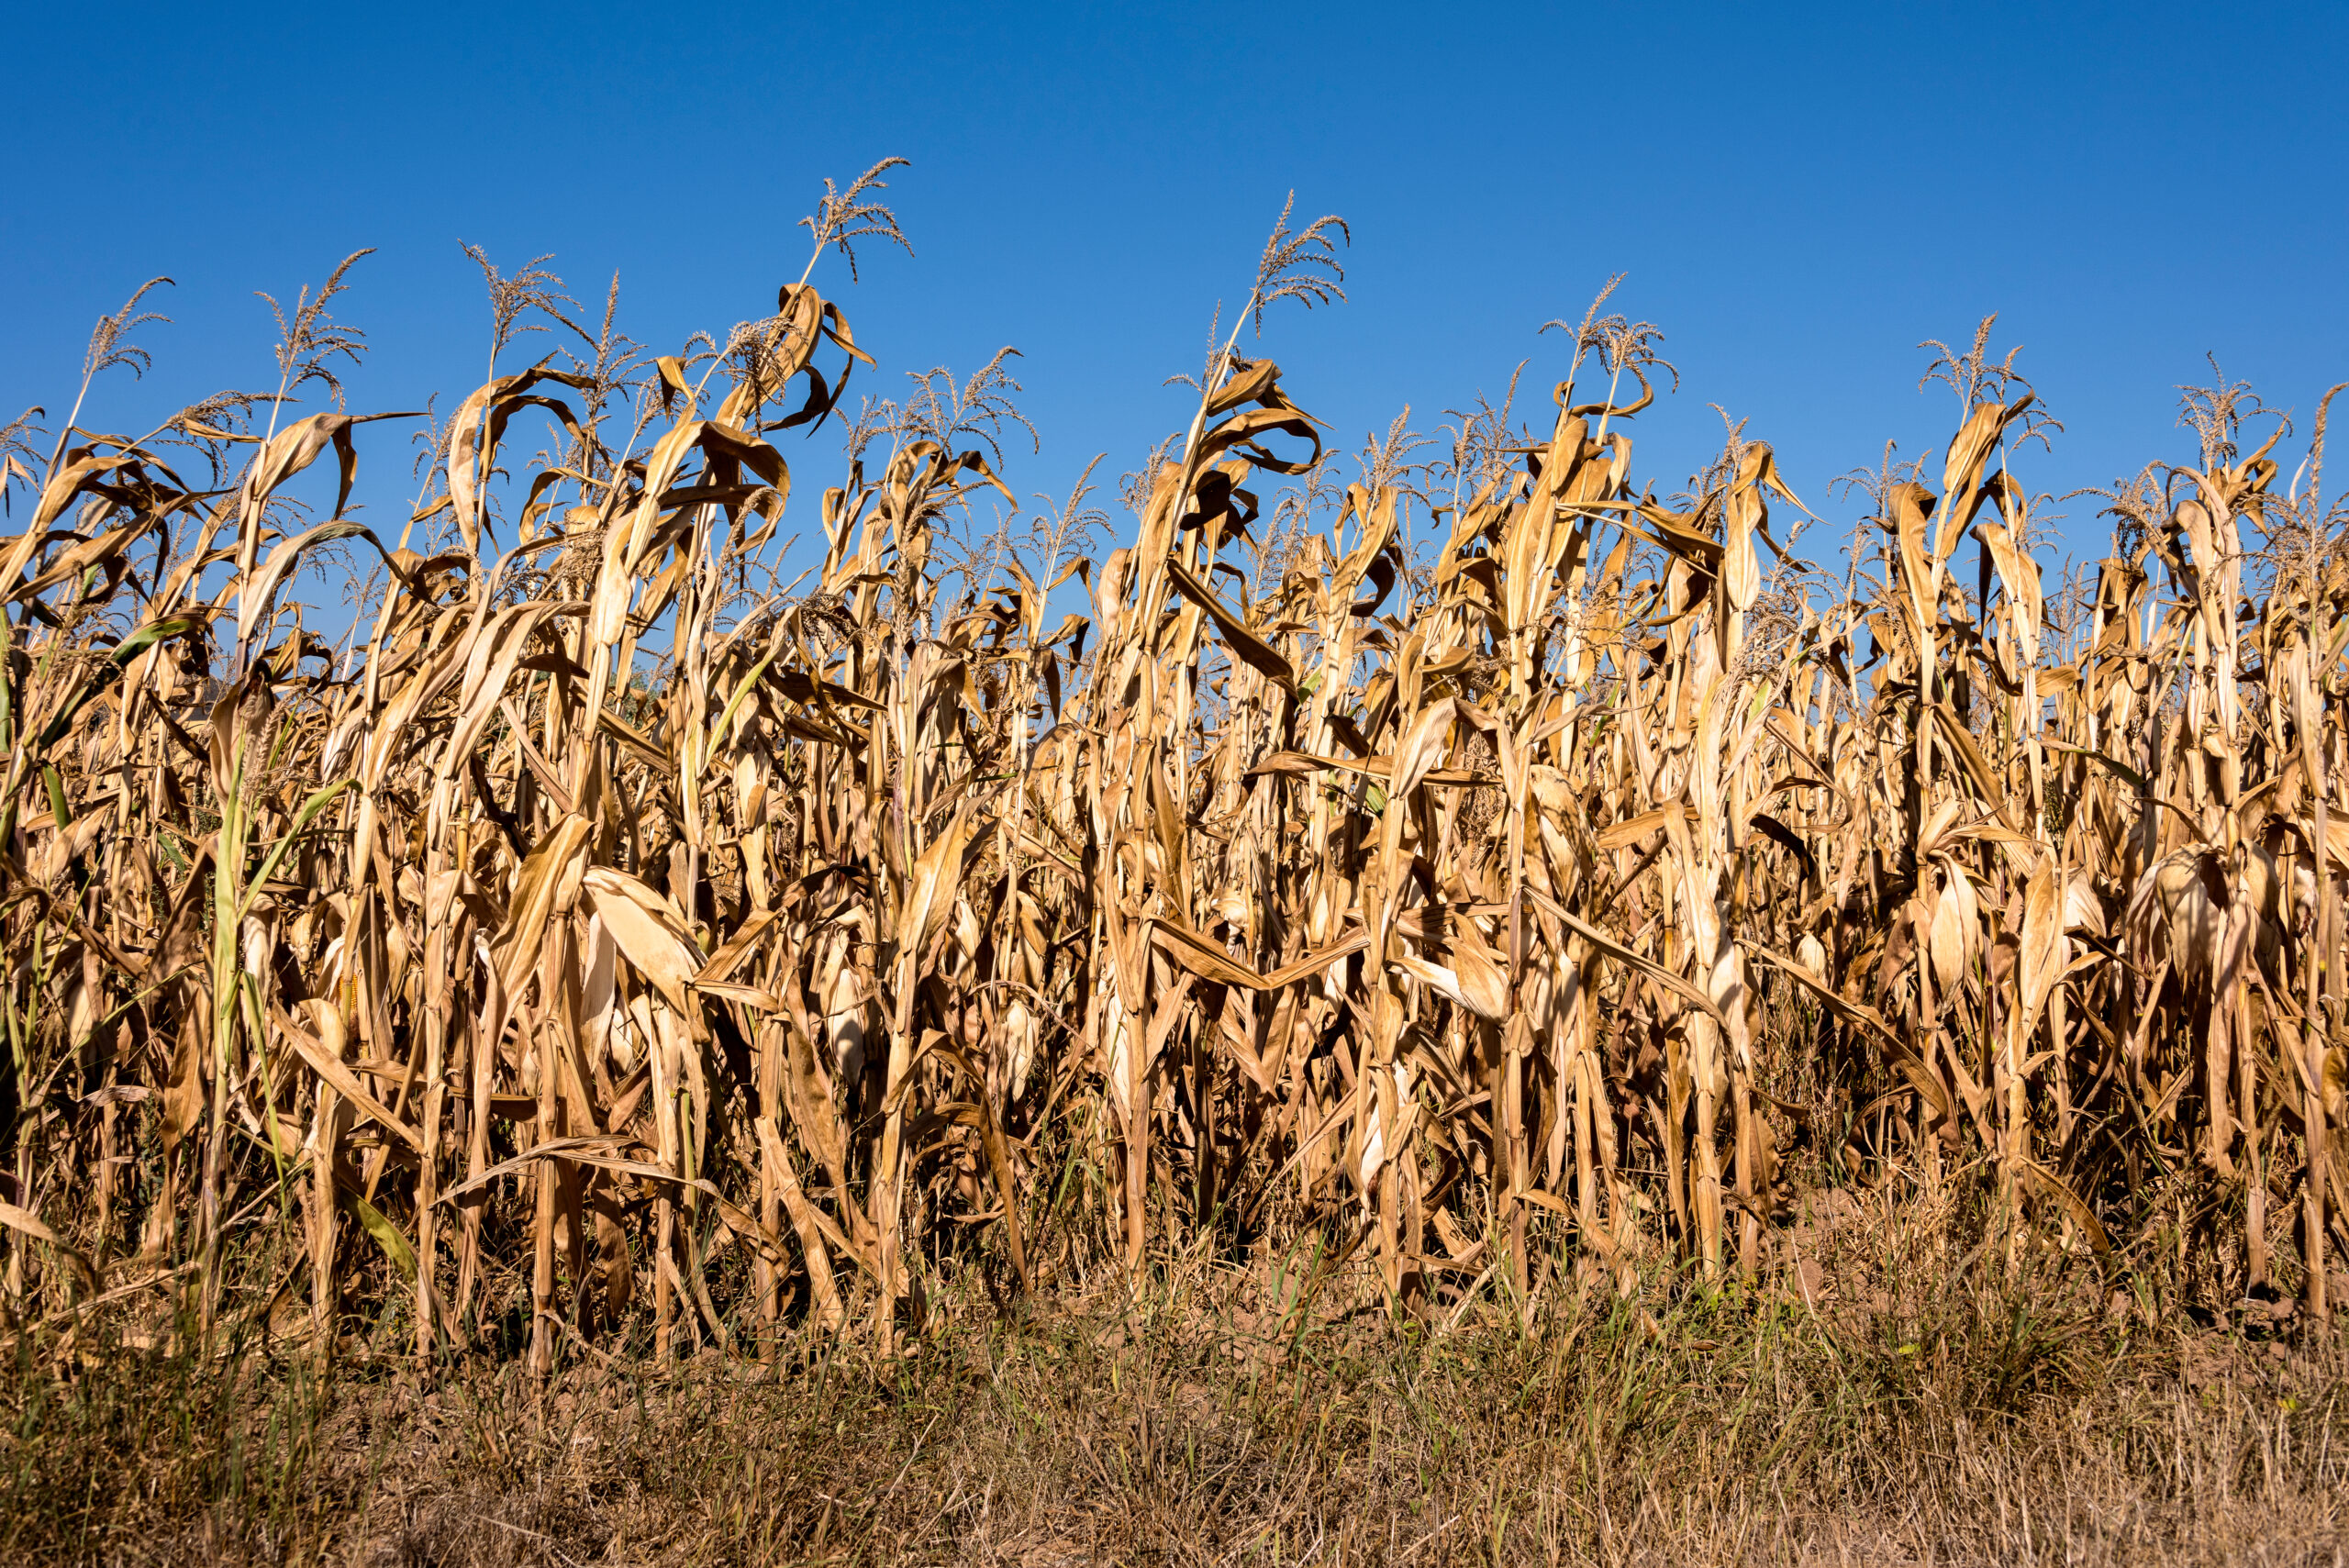 | Dry crops image | Credit: Rolf G Wackenberg/Shutterstock.com |
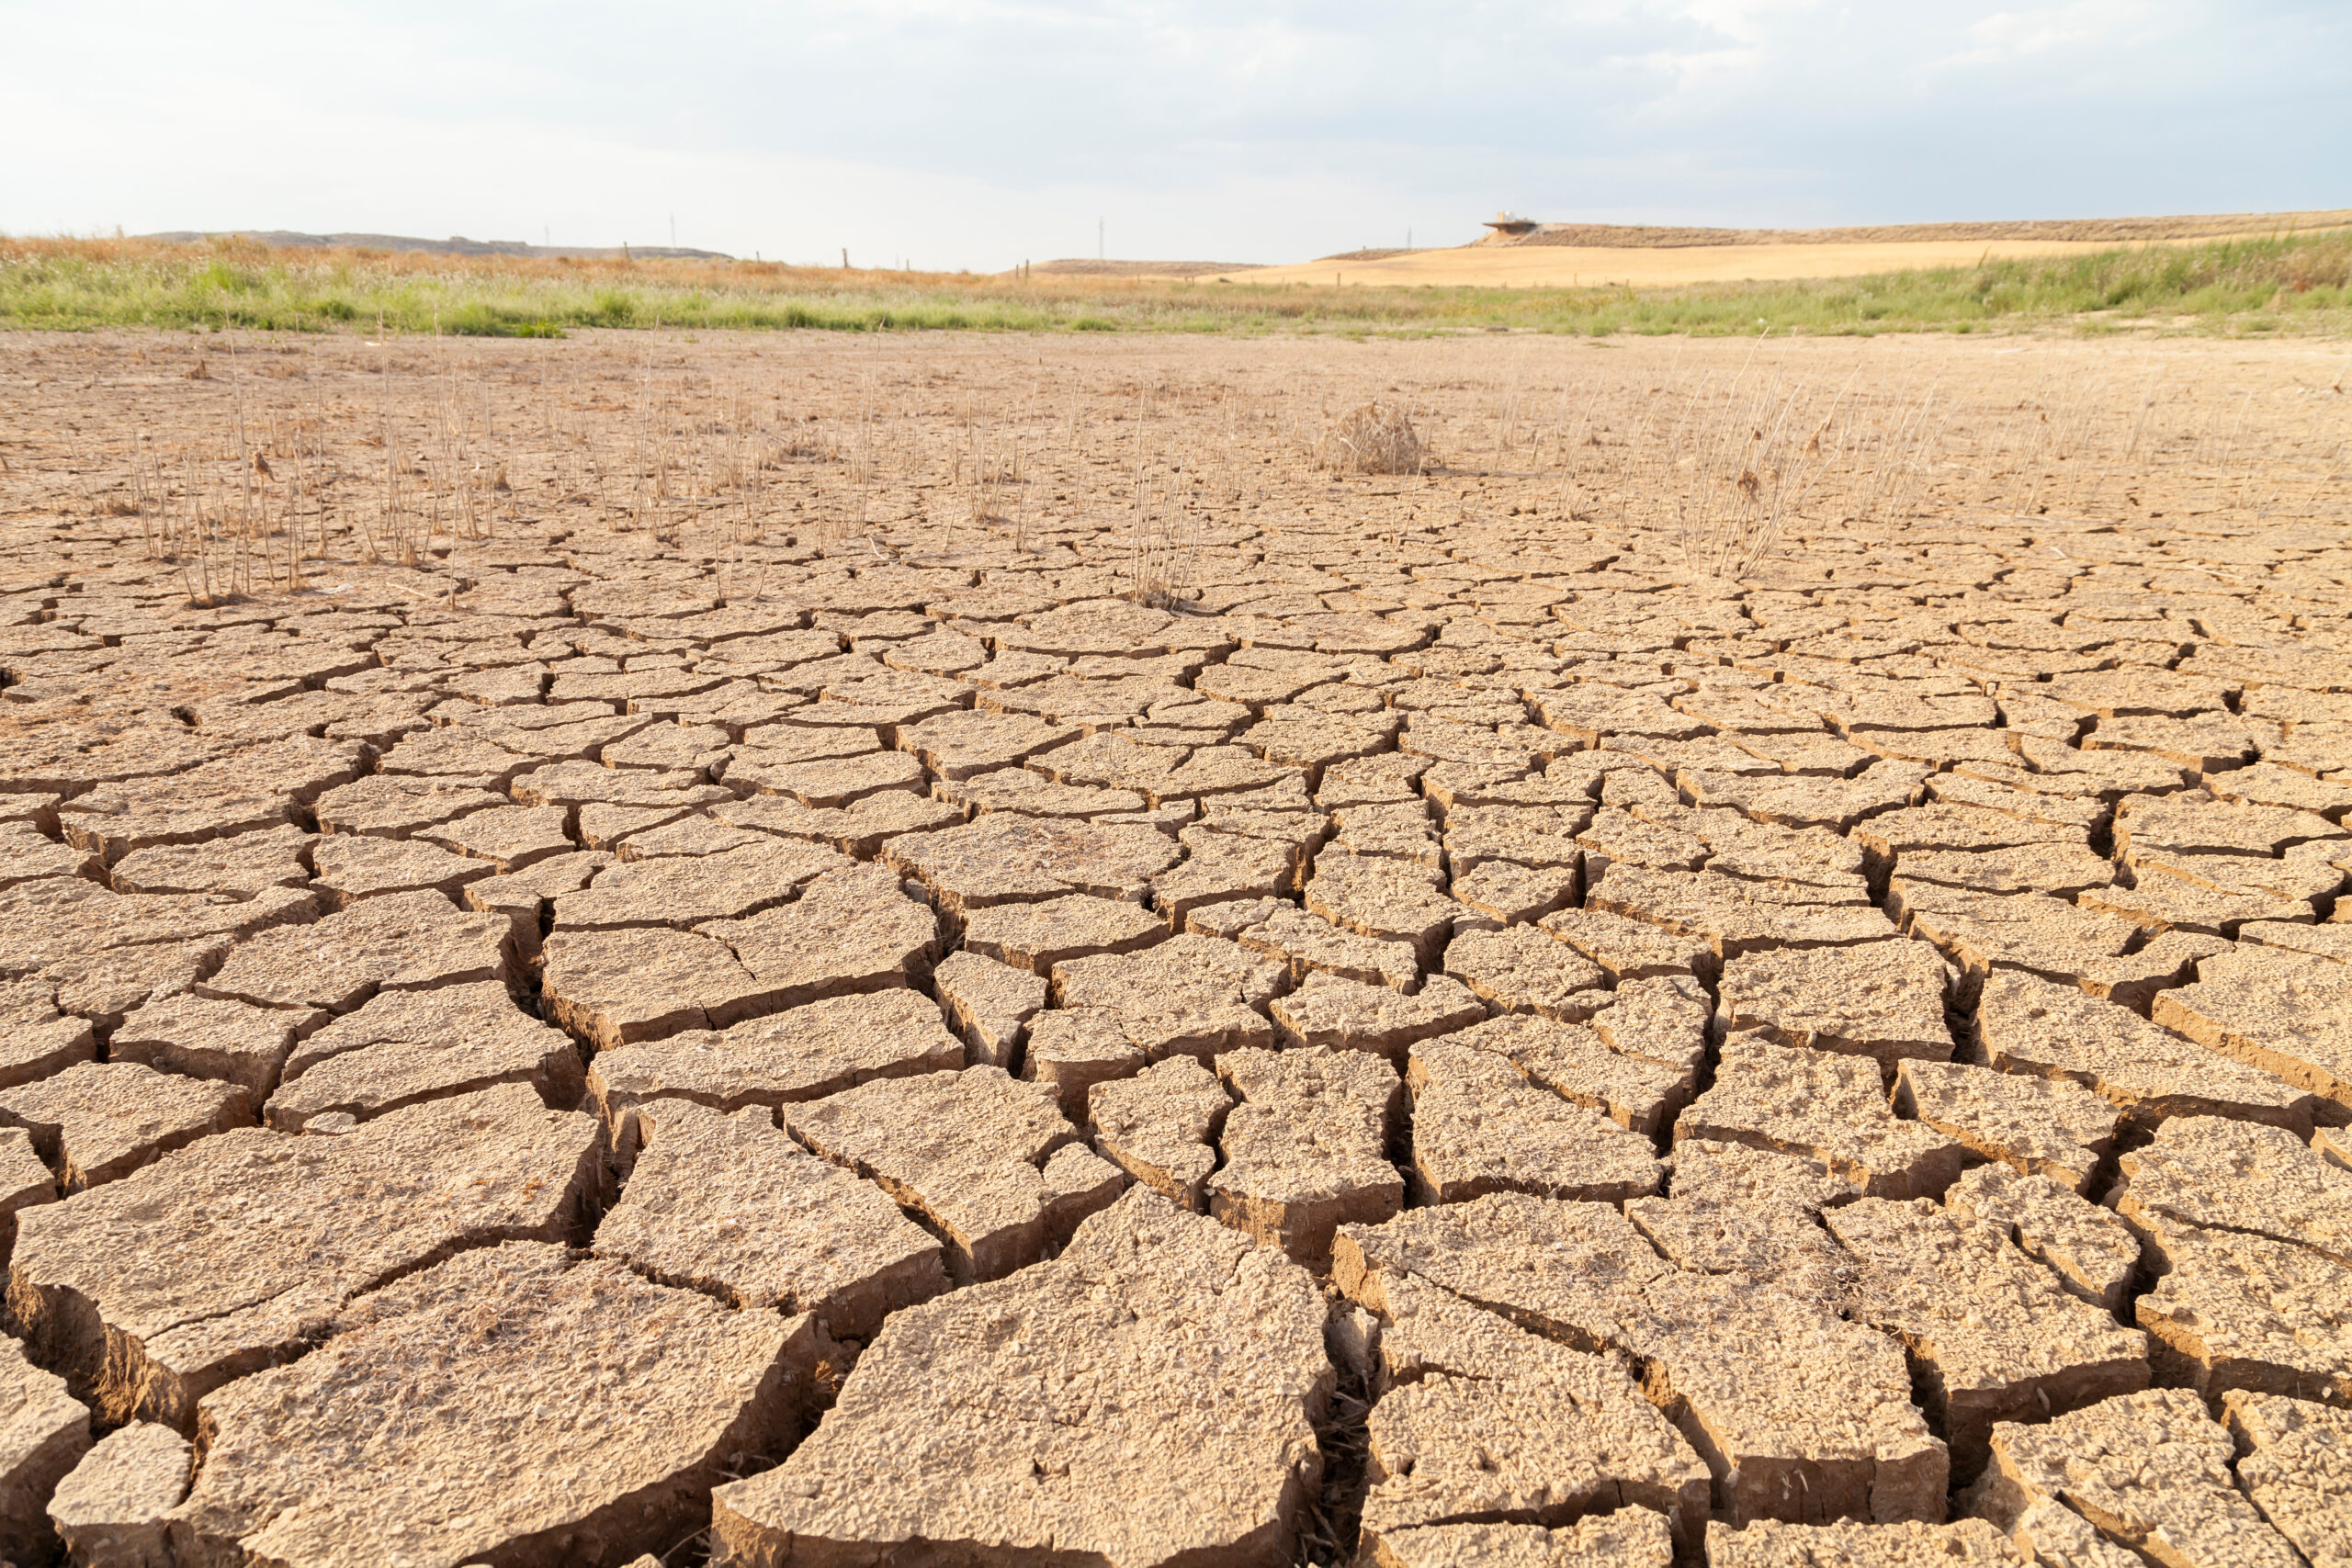 | Dry cracked land image | Credit: alvarobueno/Shutterstock.com |
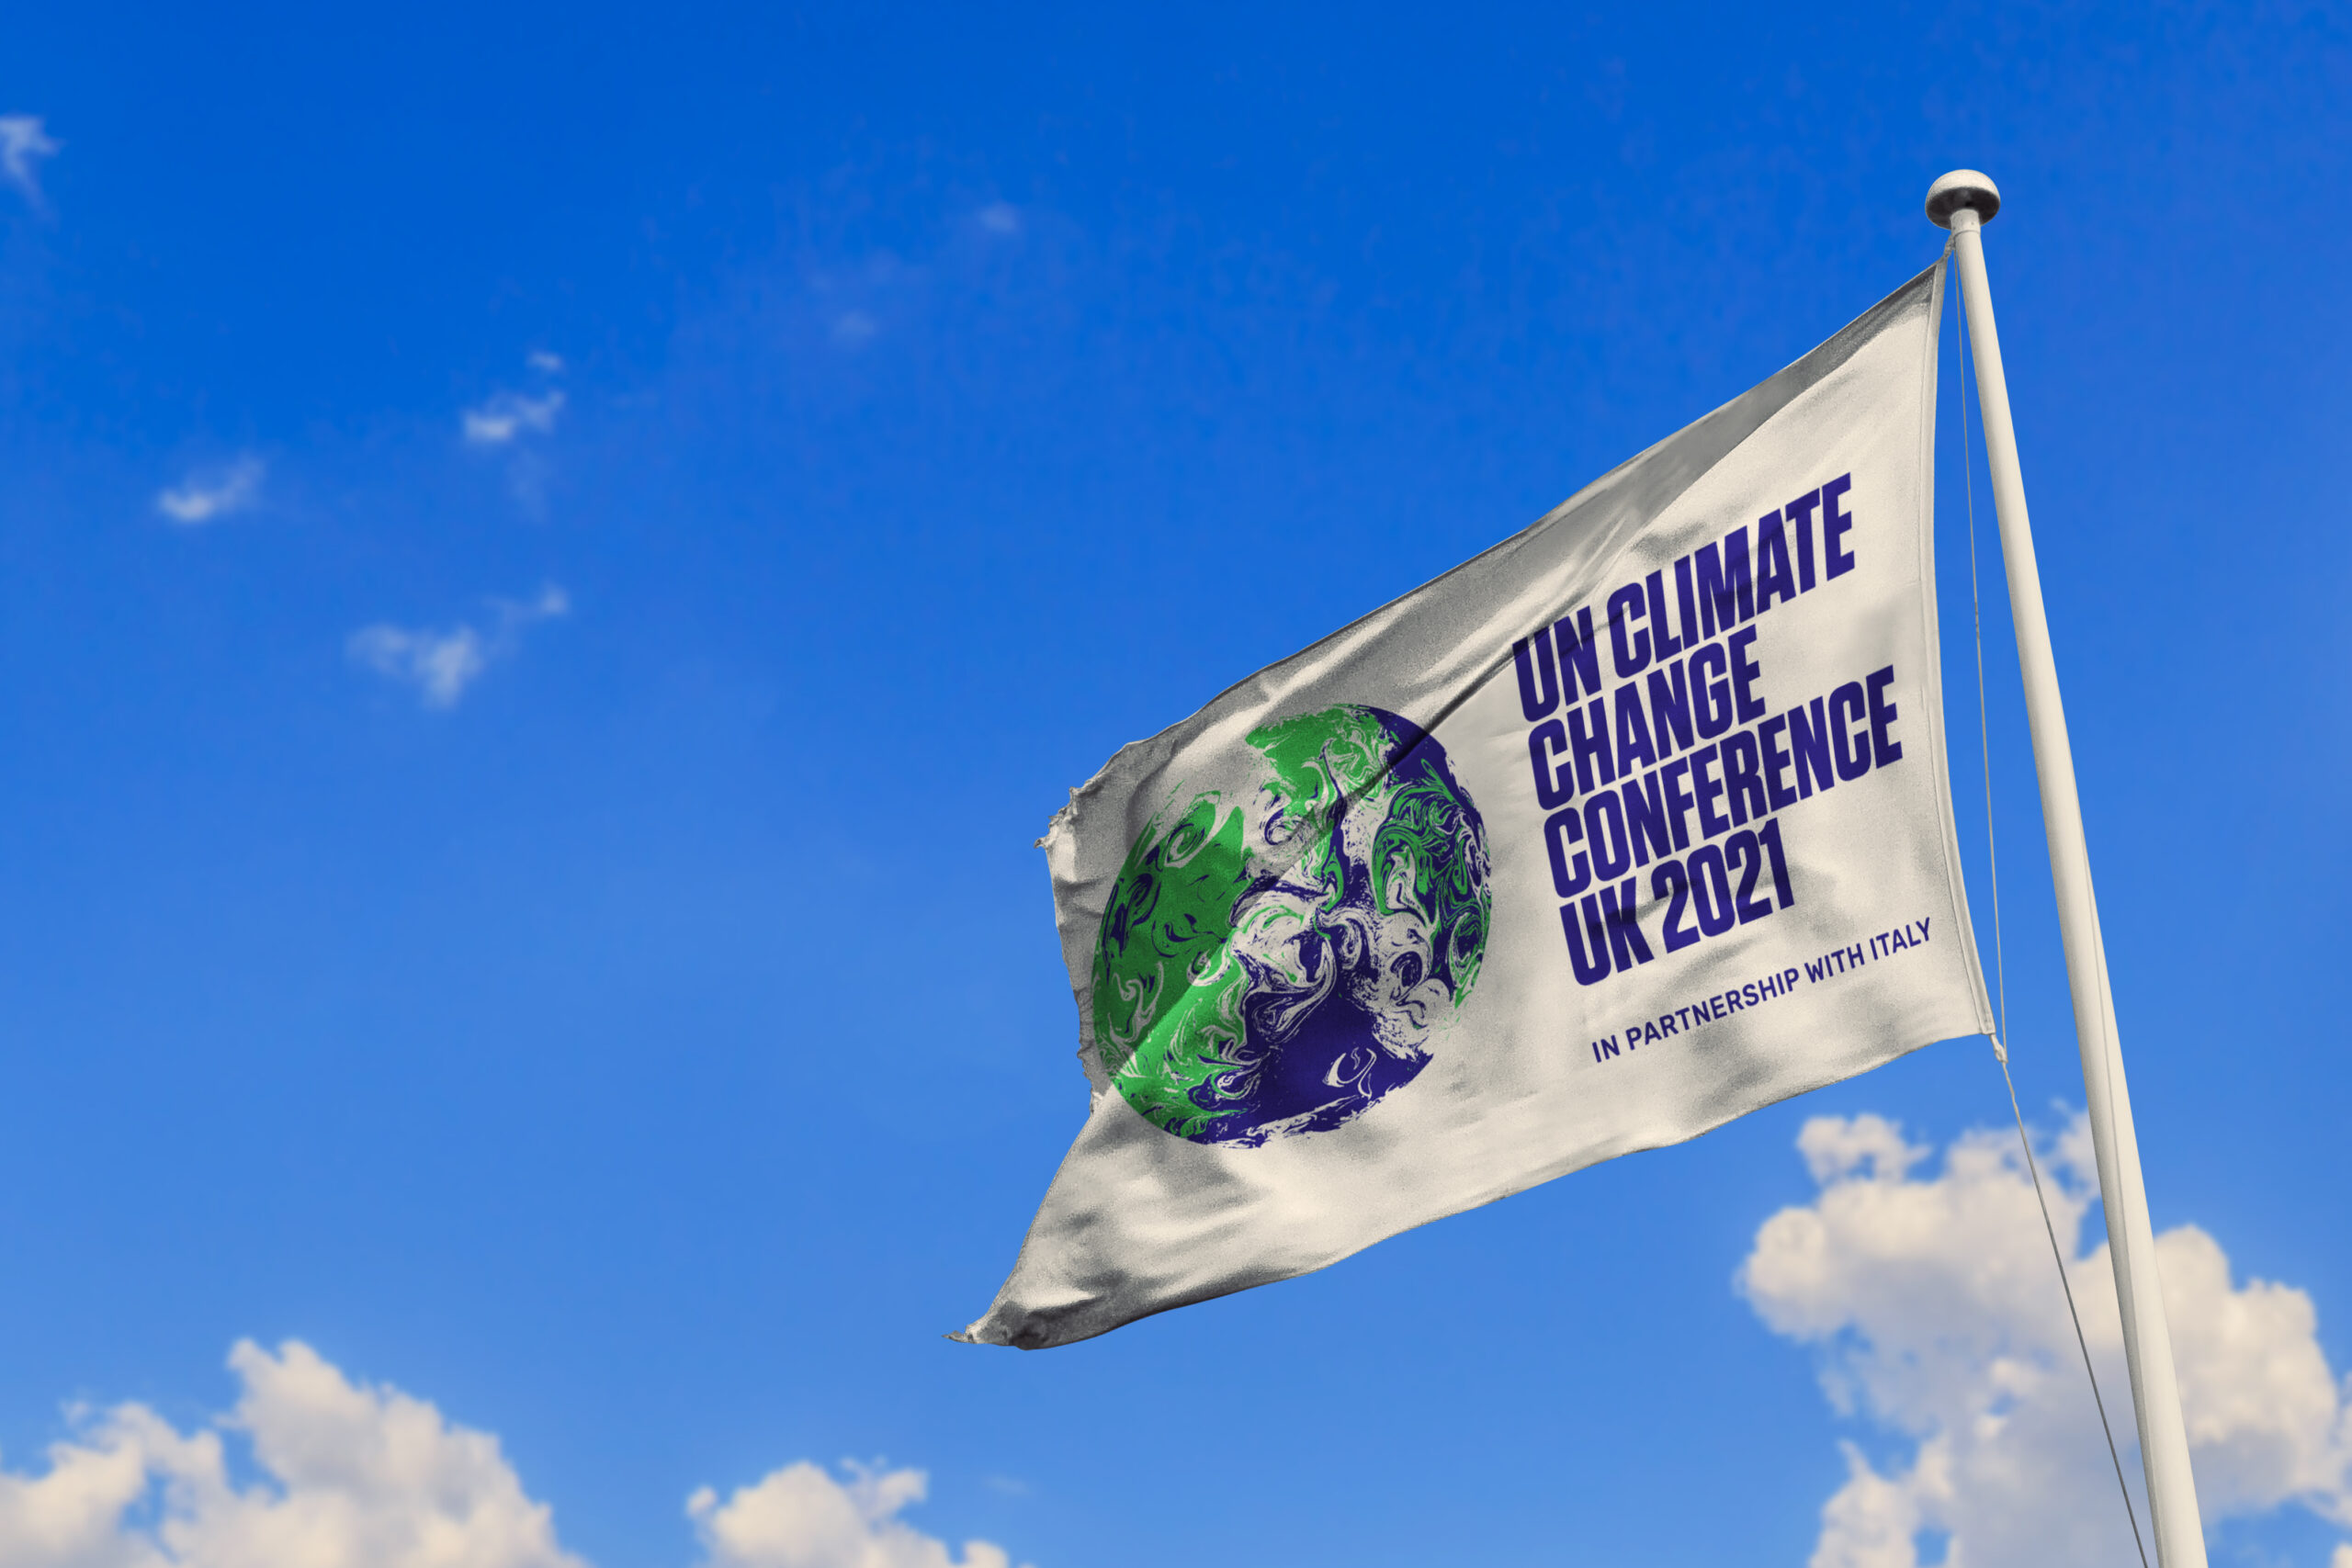 | COP26 flag | Credit: rafapress/Shutterstock.com |
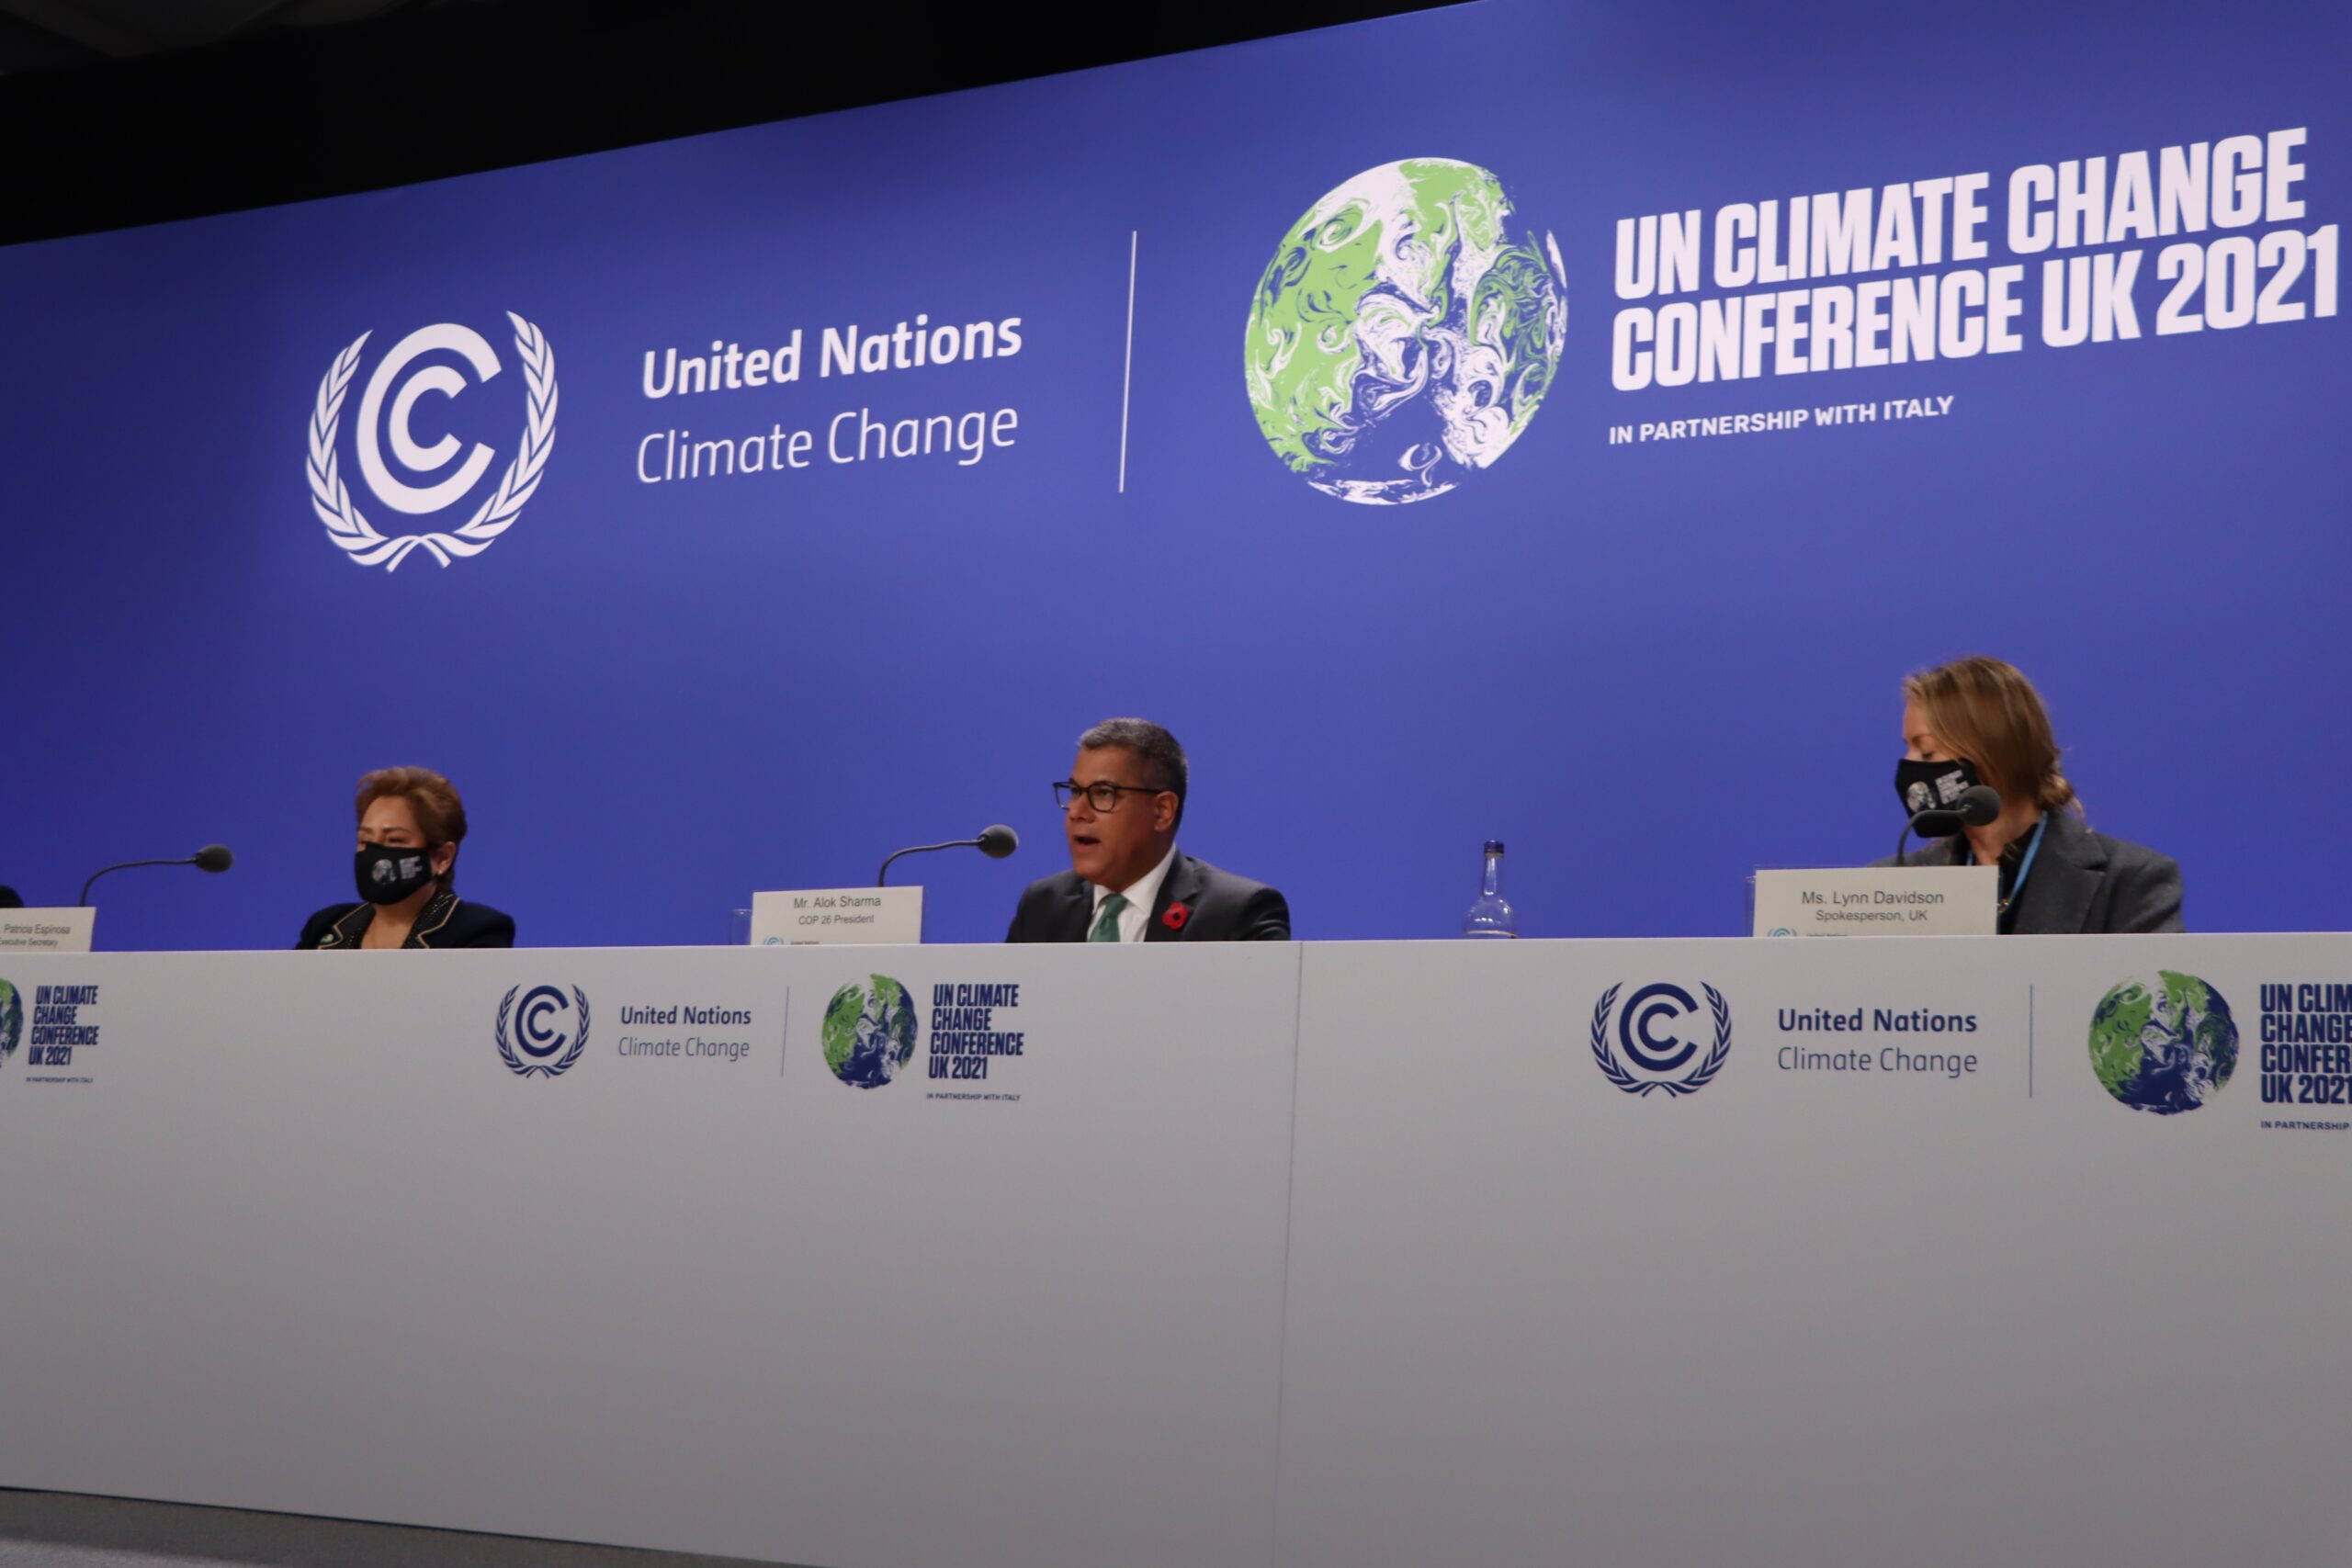 | COP26 image | Credit: Paul Adepoju/Shutterstock.com |
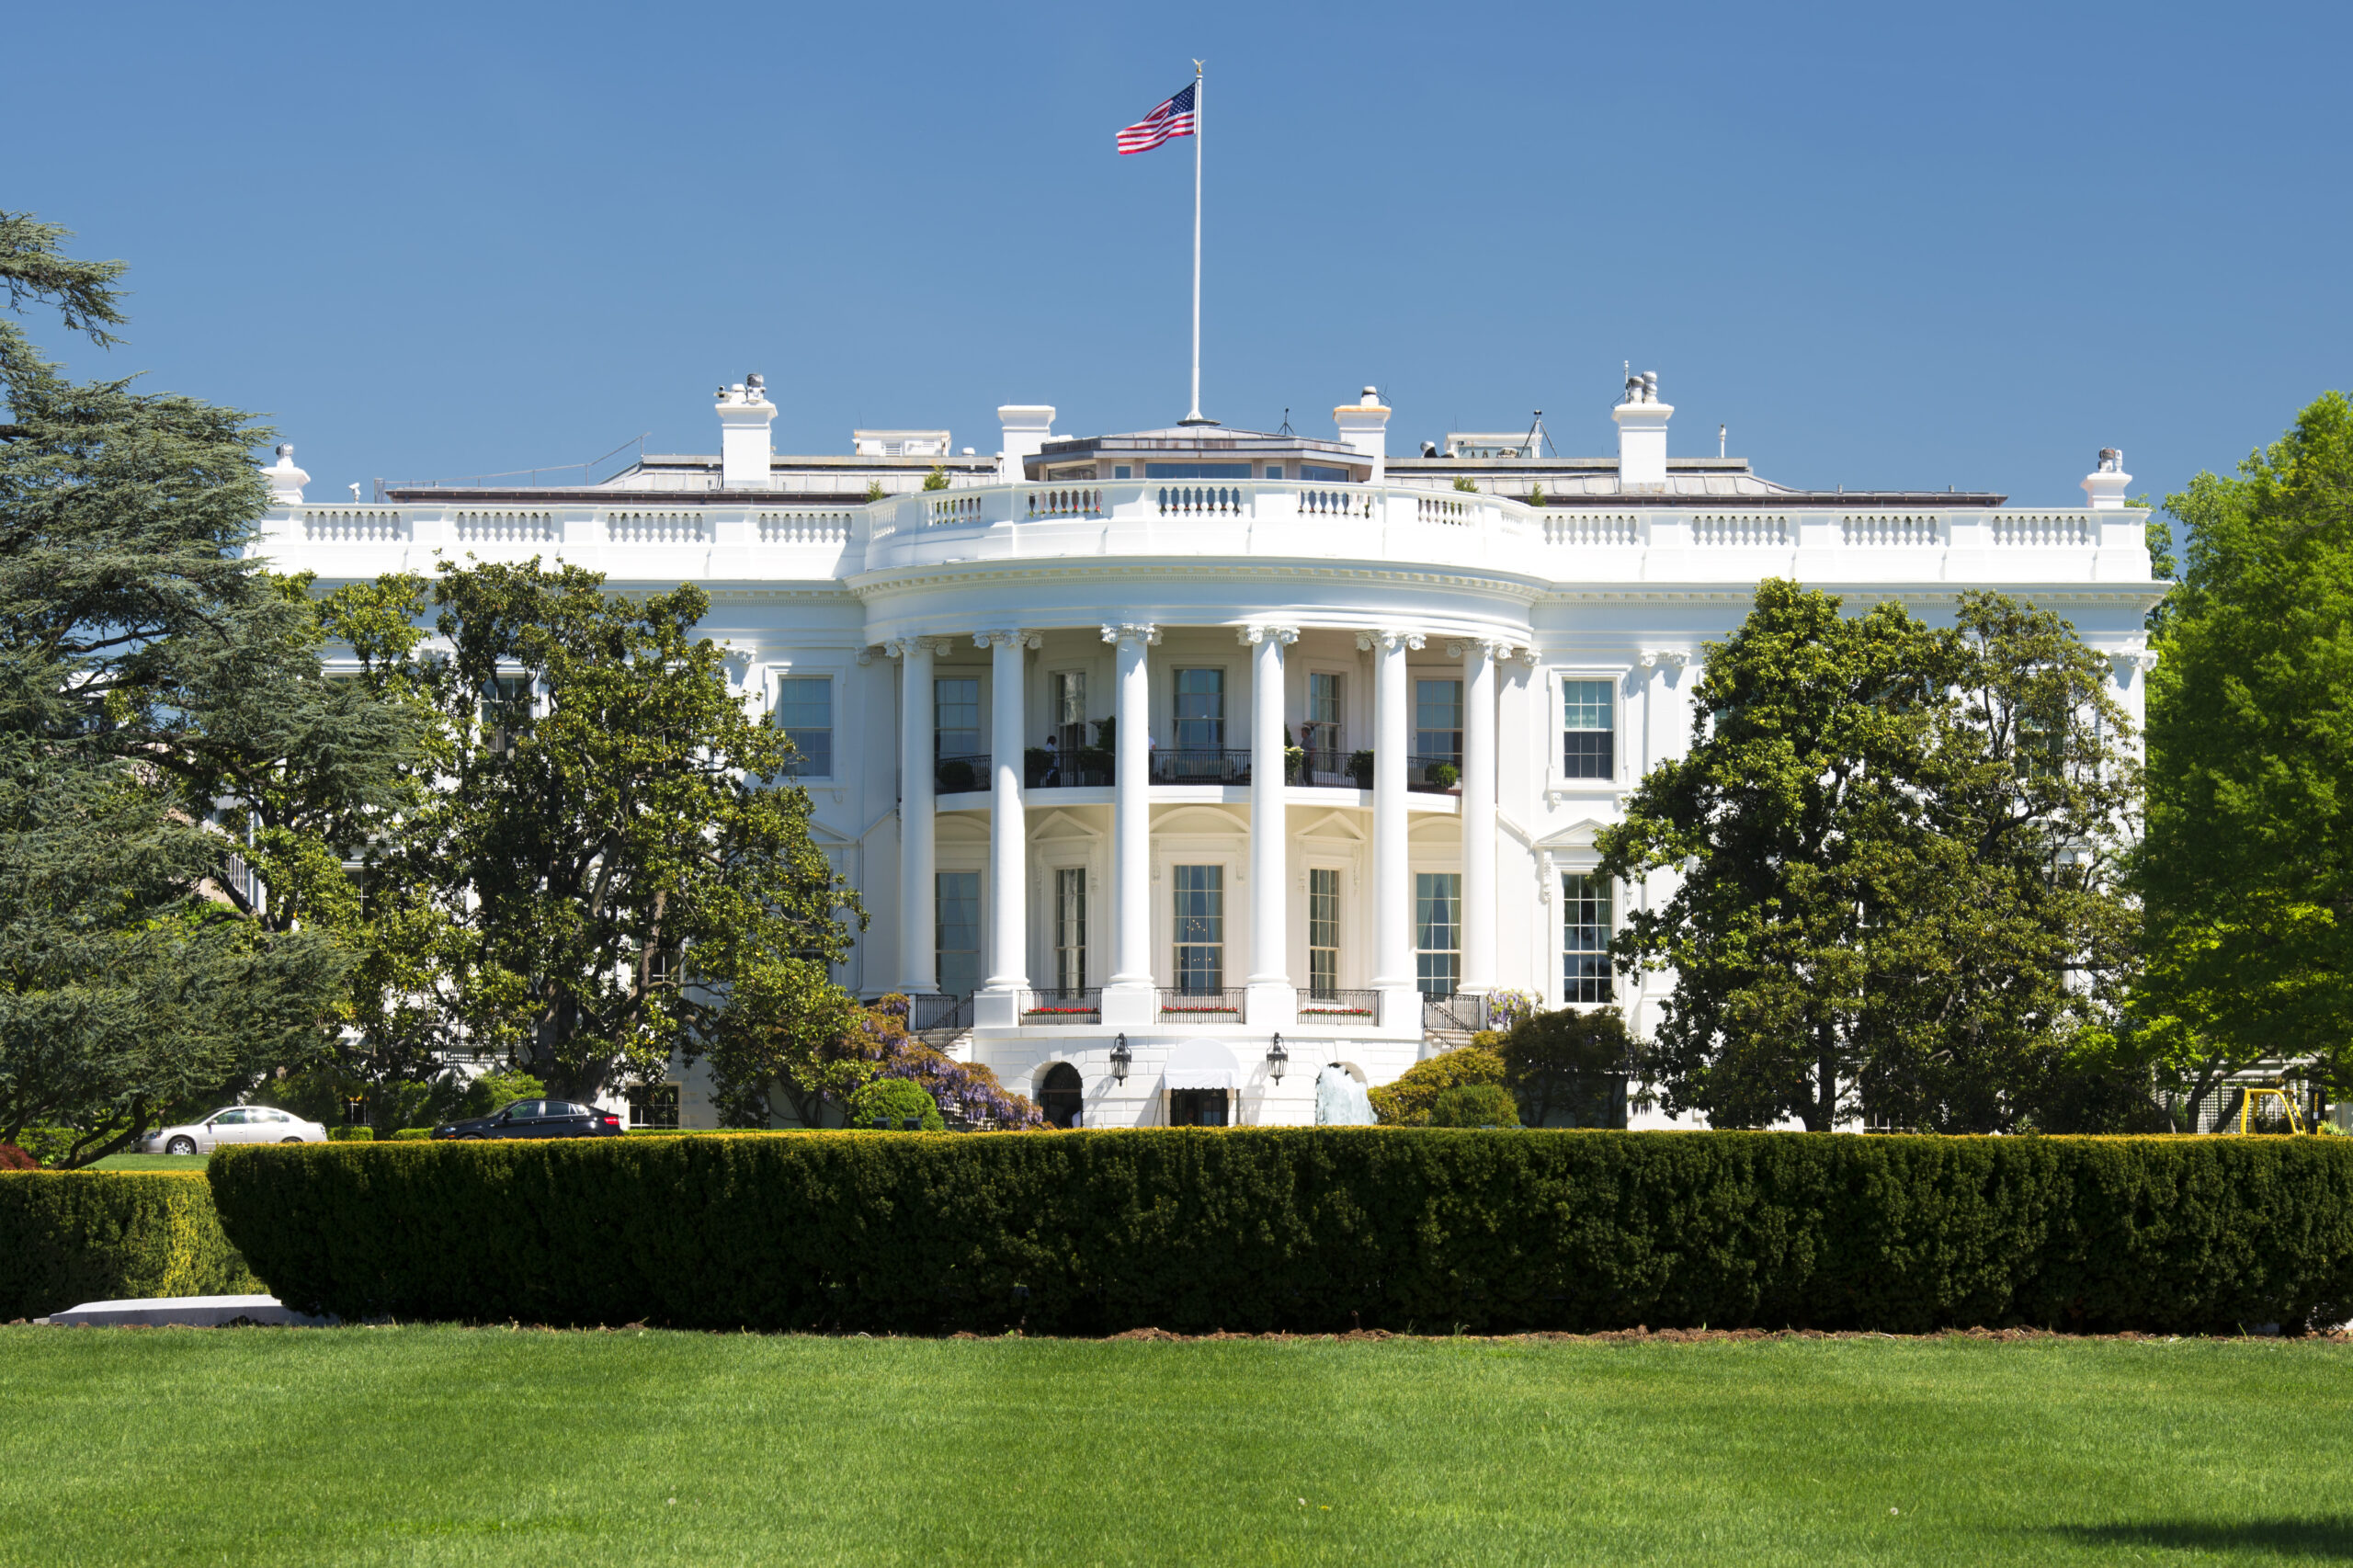 | White House image | Credit: Andrea Izzotti/Shutterstock.com |
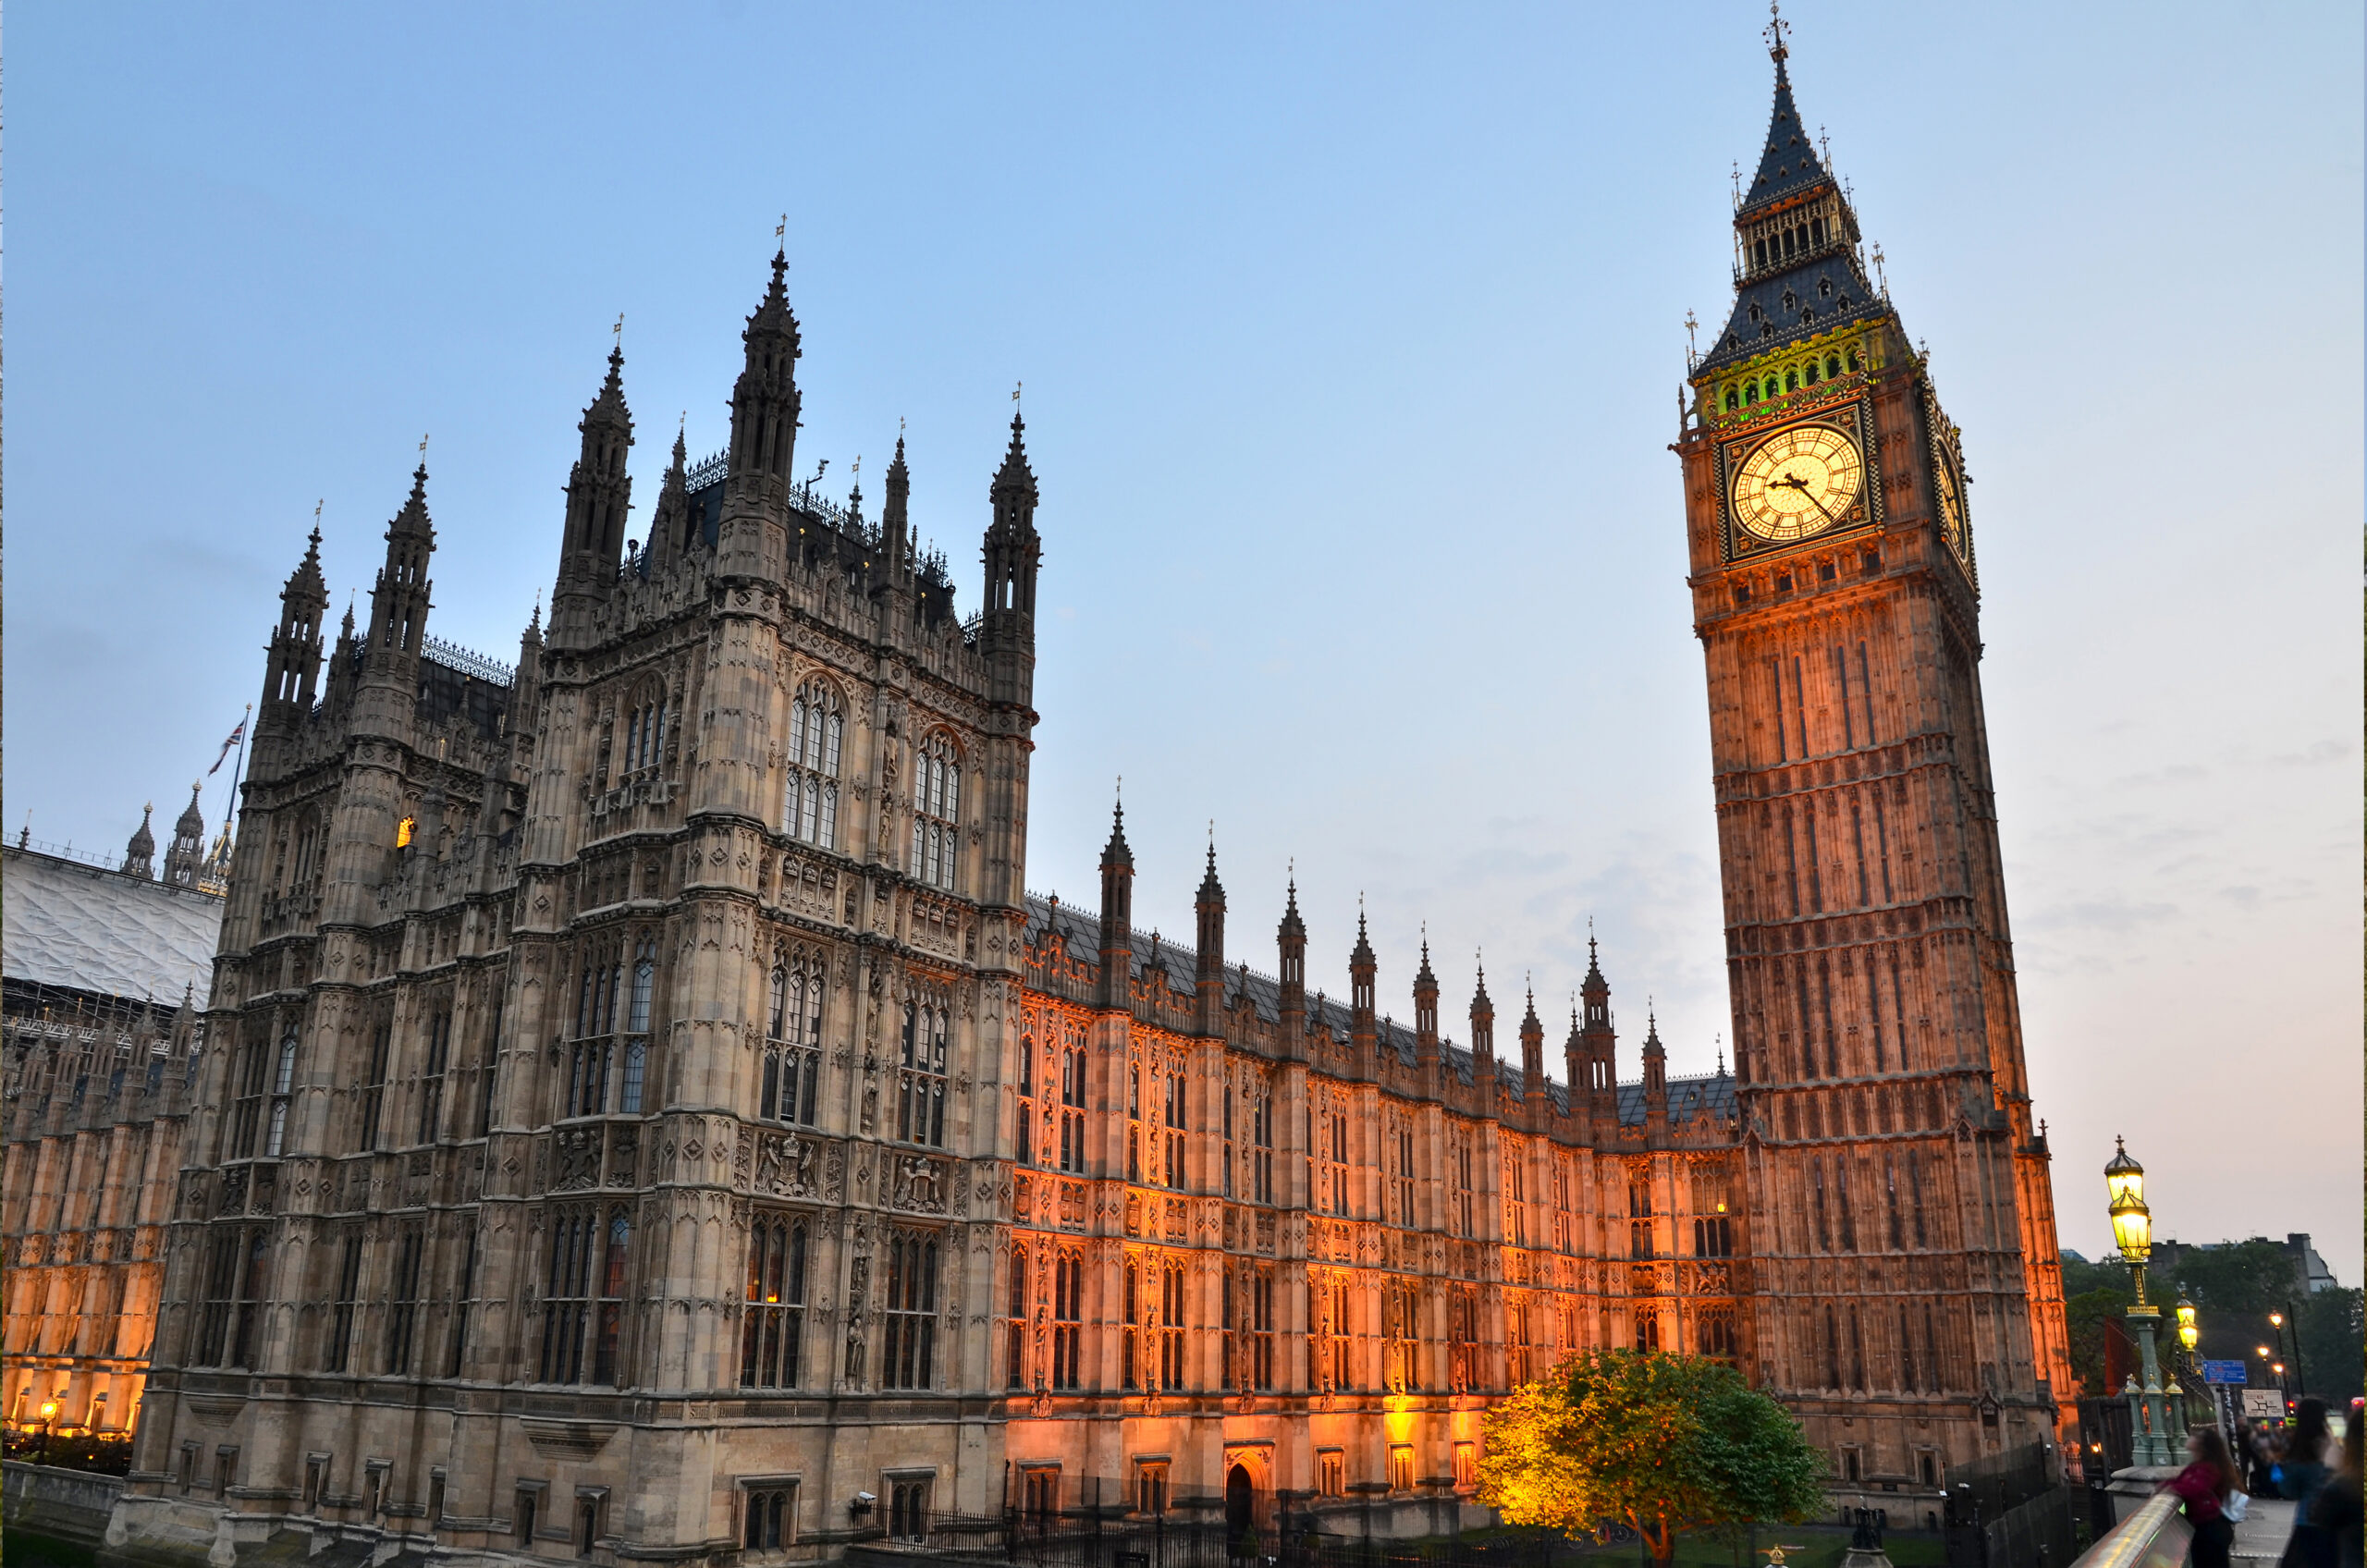 | Westminster image | Credit: Cristian Gusa/Shutterstock.com |
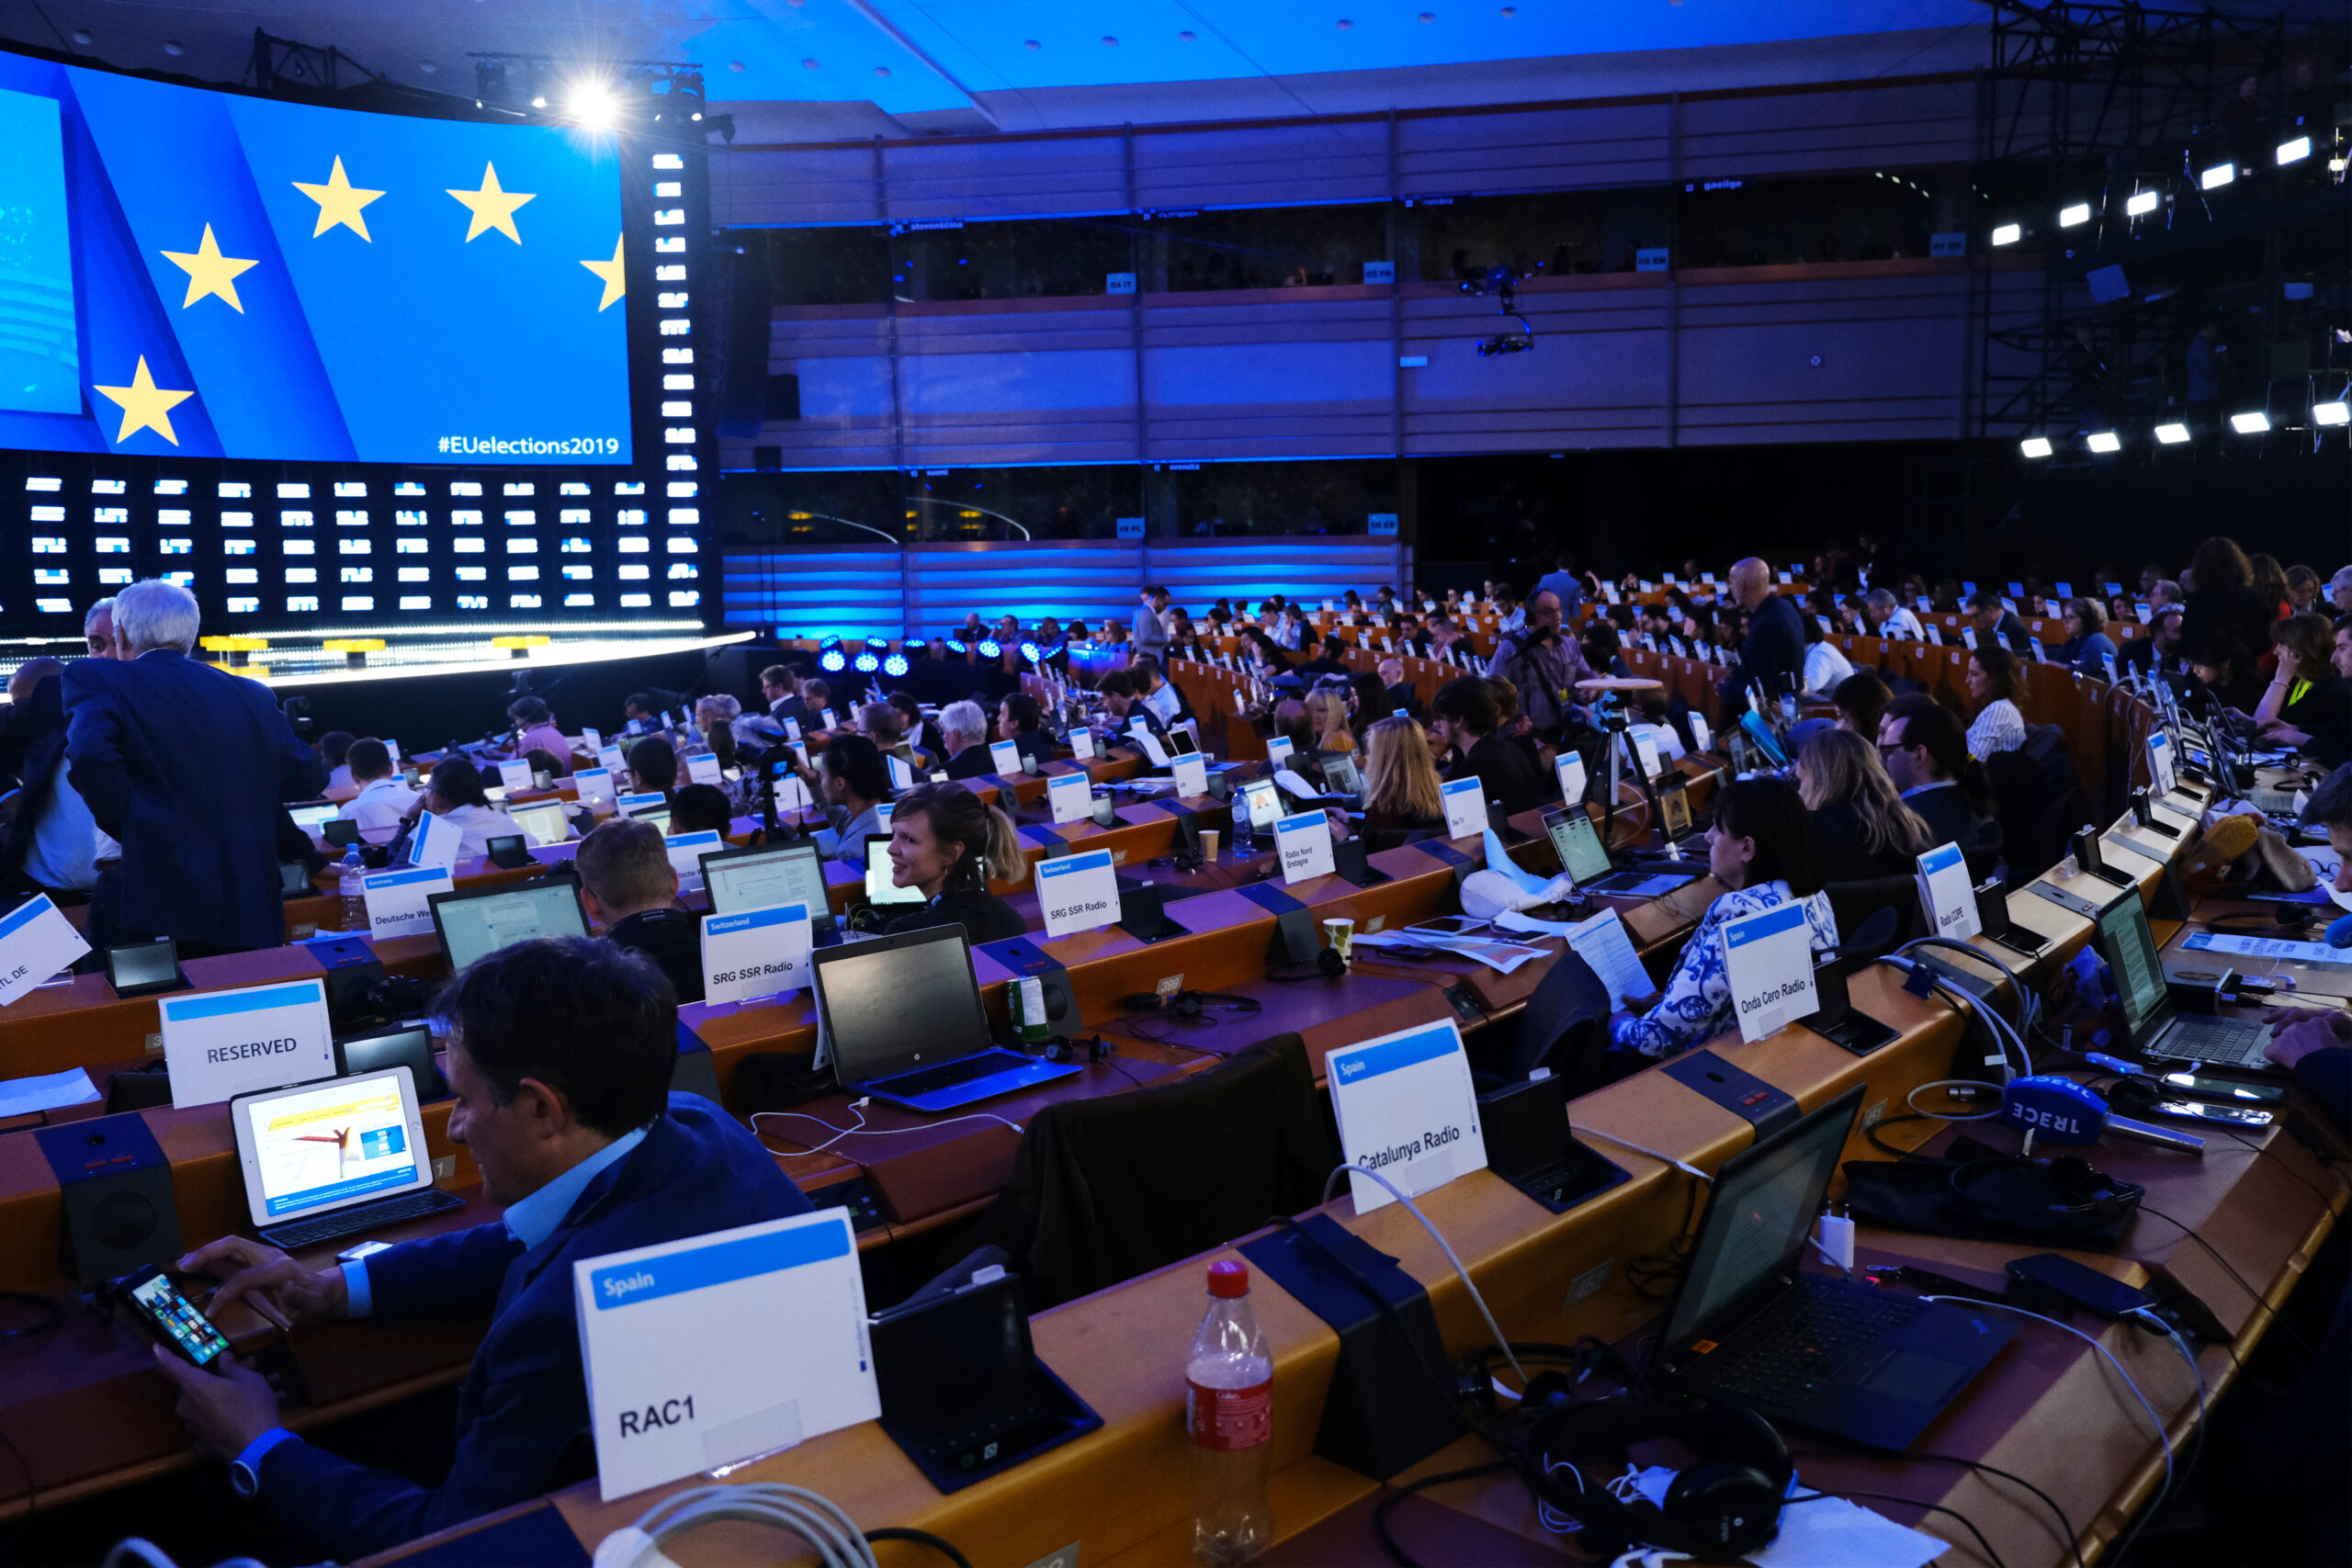 | EU Commission image | Credit: Alexandros Michailidis/Shutterstock.com |
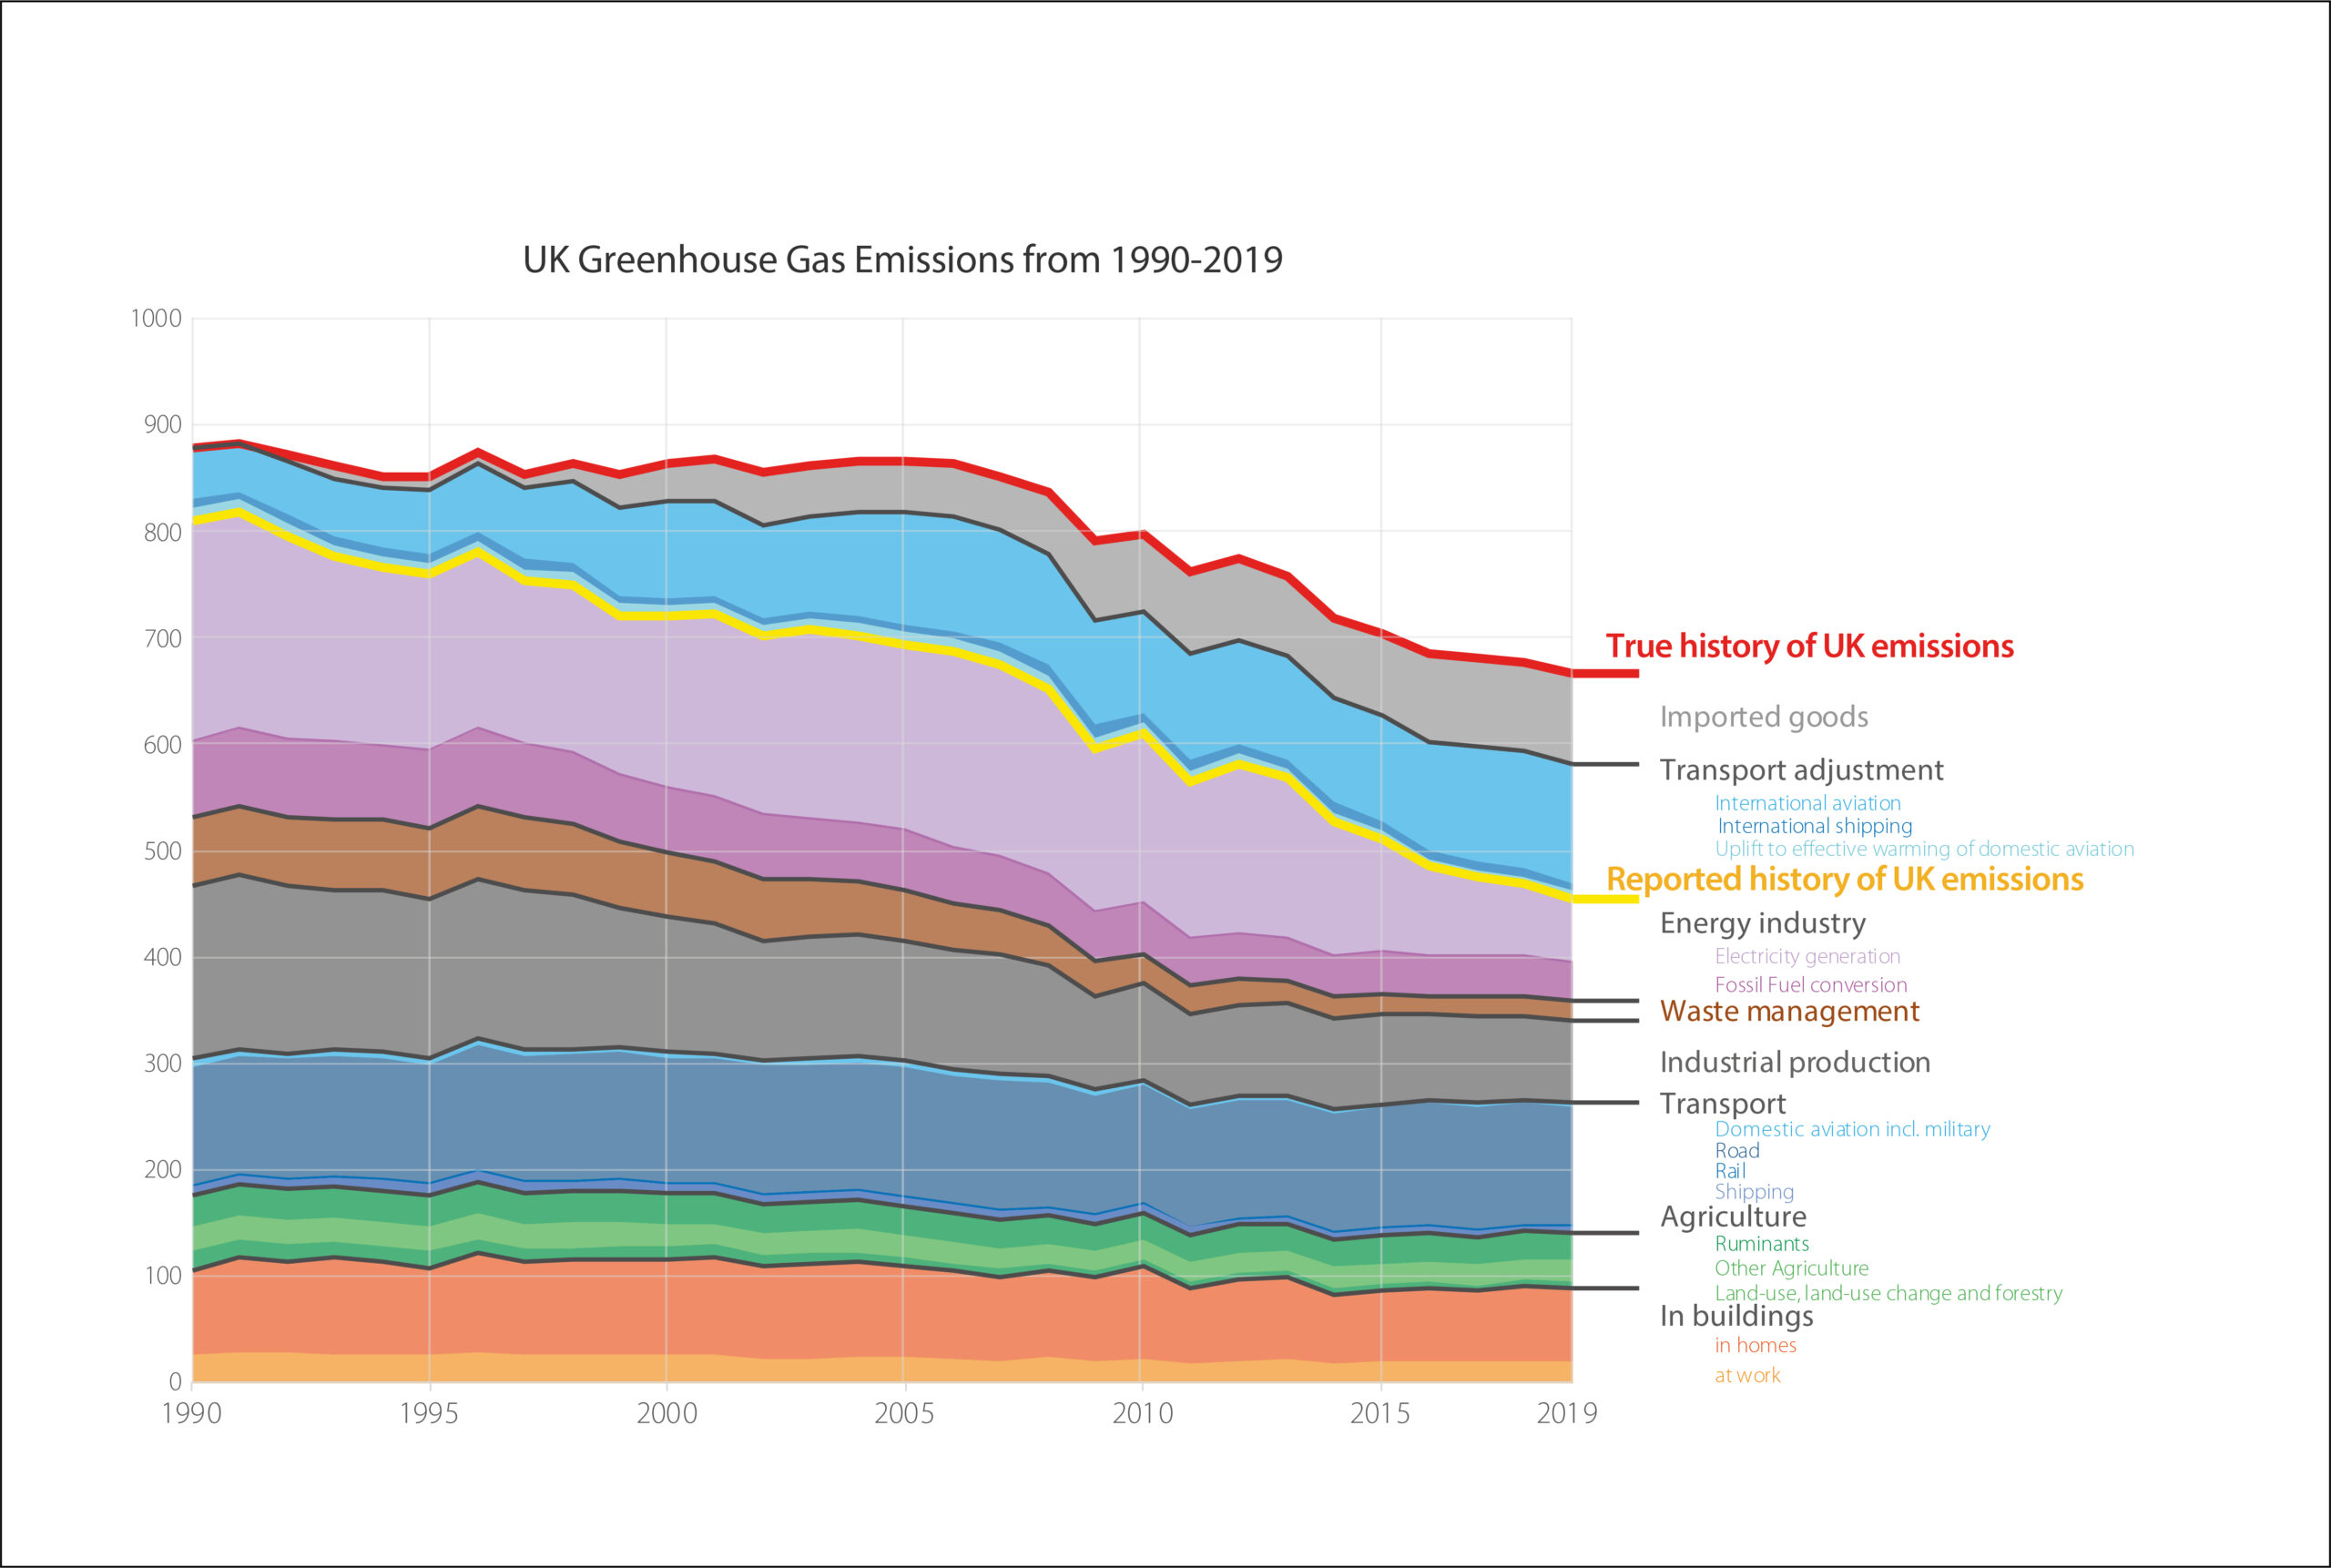 | UK Emissions | Derived from tables 1.2 and 6.1 in Final UK GHG emissions national statistics 1990-2019 – BEIS https://www.gov.uk/government/collections/final-uk-greenhouse-gas-emissions-national-statistics |
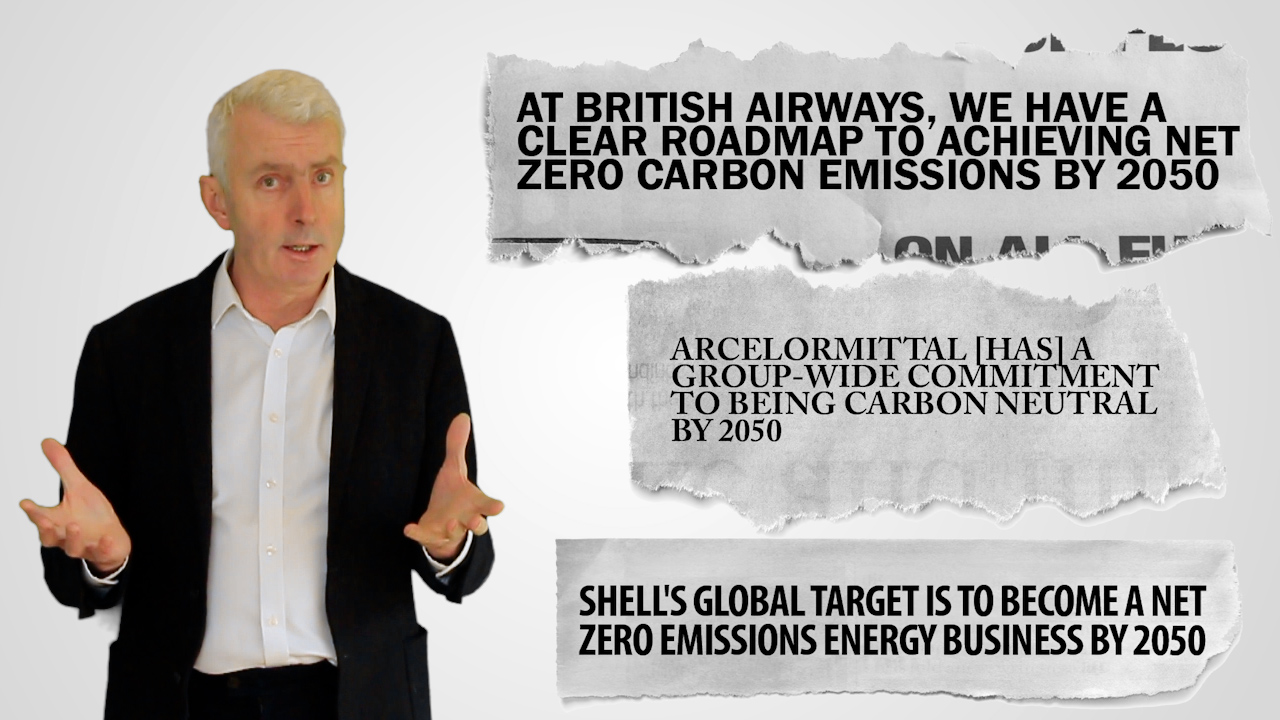 | BA, Shell, Arcelor Mittal net zero committments | https://www.shell.co.uk/a-cleaner-energy-future/our-response-to-climate-change.html; https://corporate.arcelormittal.com/media/press-releases/arcelormittal-sets-2050-group-carbon-emissions-target-of-net-zero; https://www.britishairways.com/en-gb/information/about-ba/ba-better-world/planet |
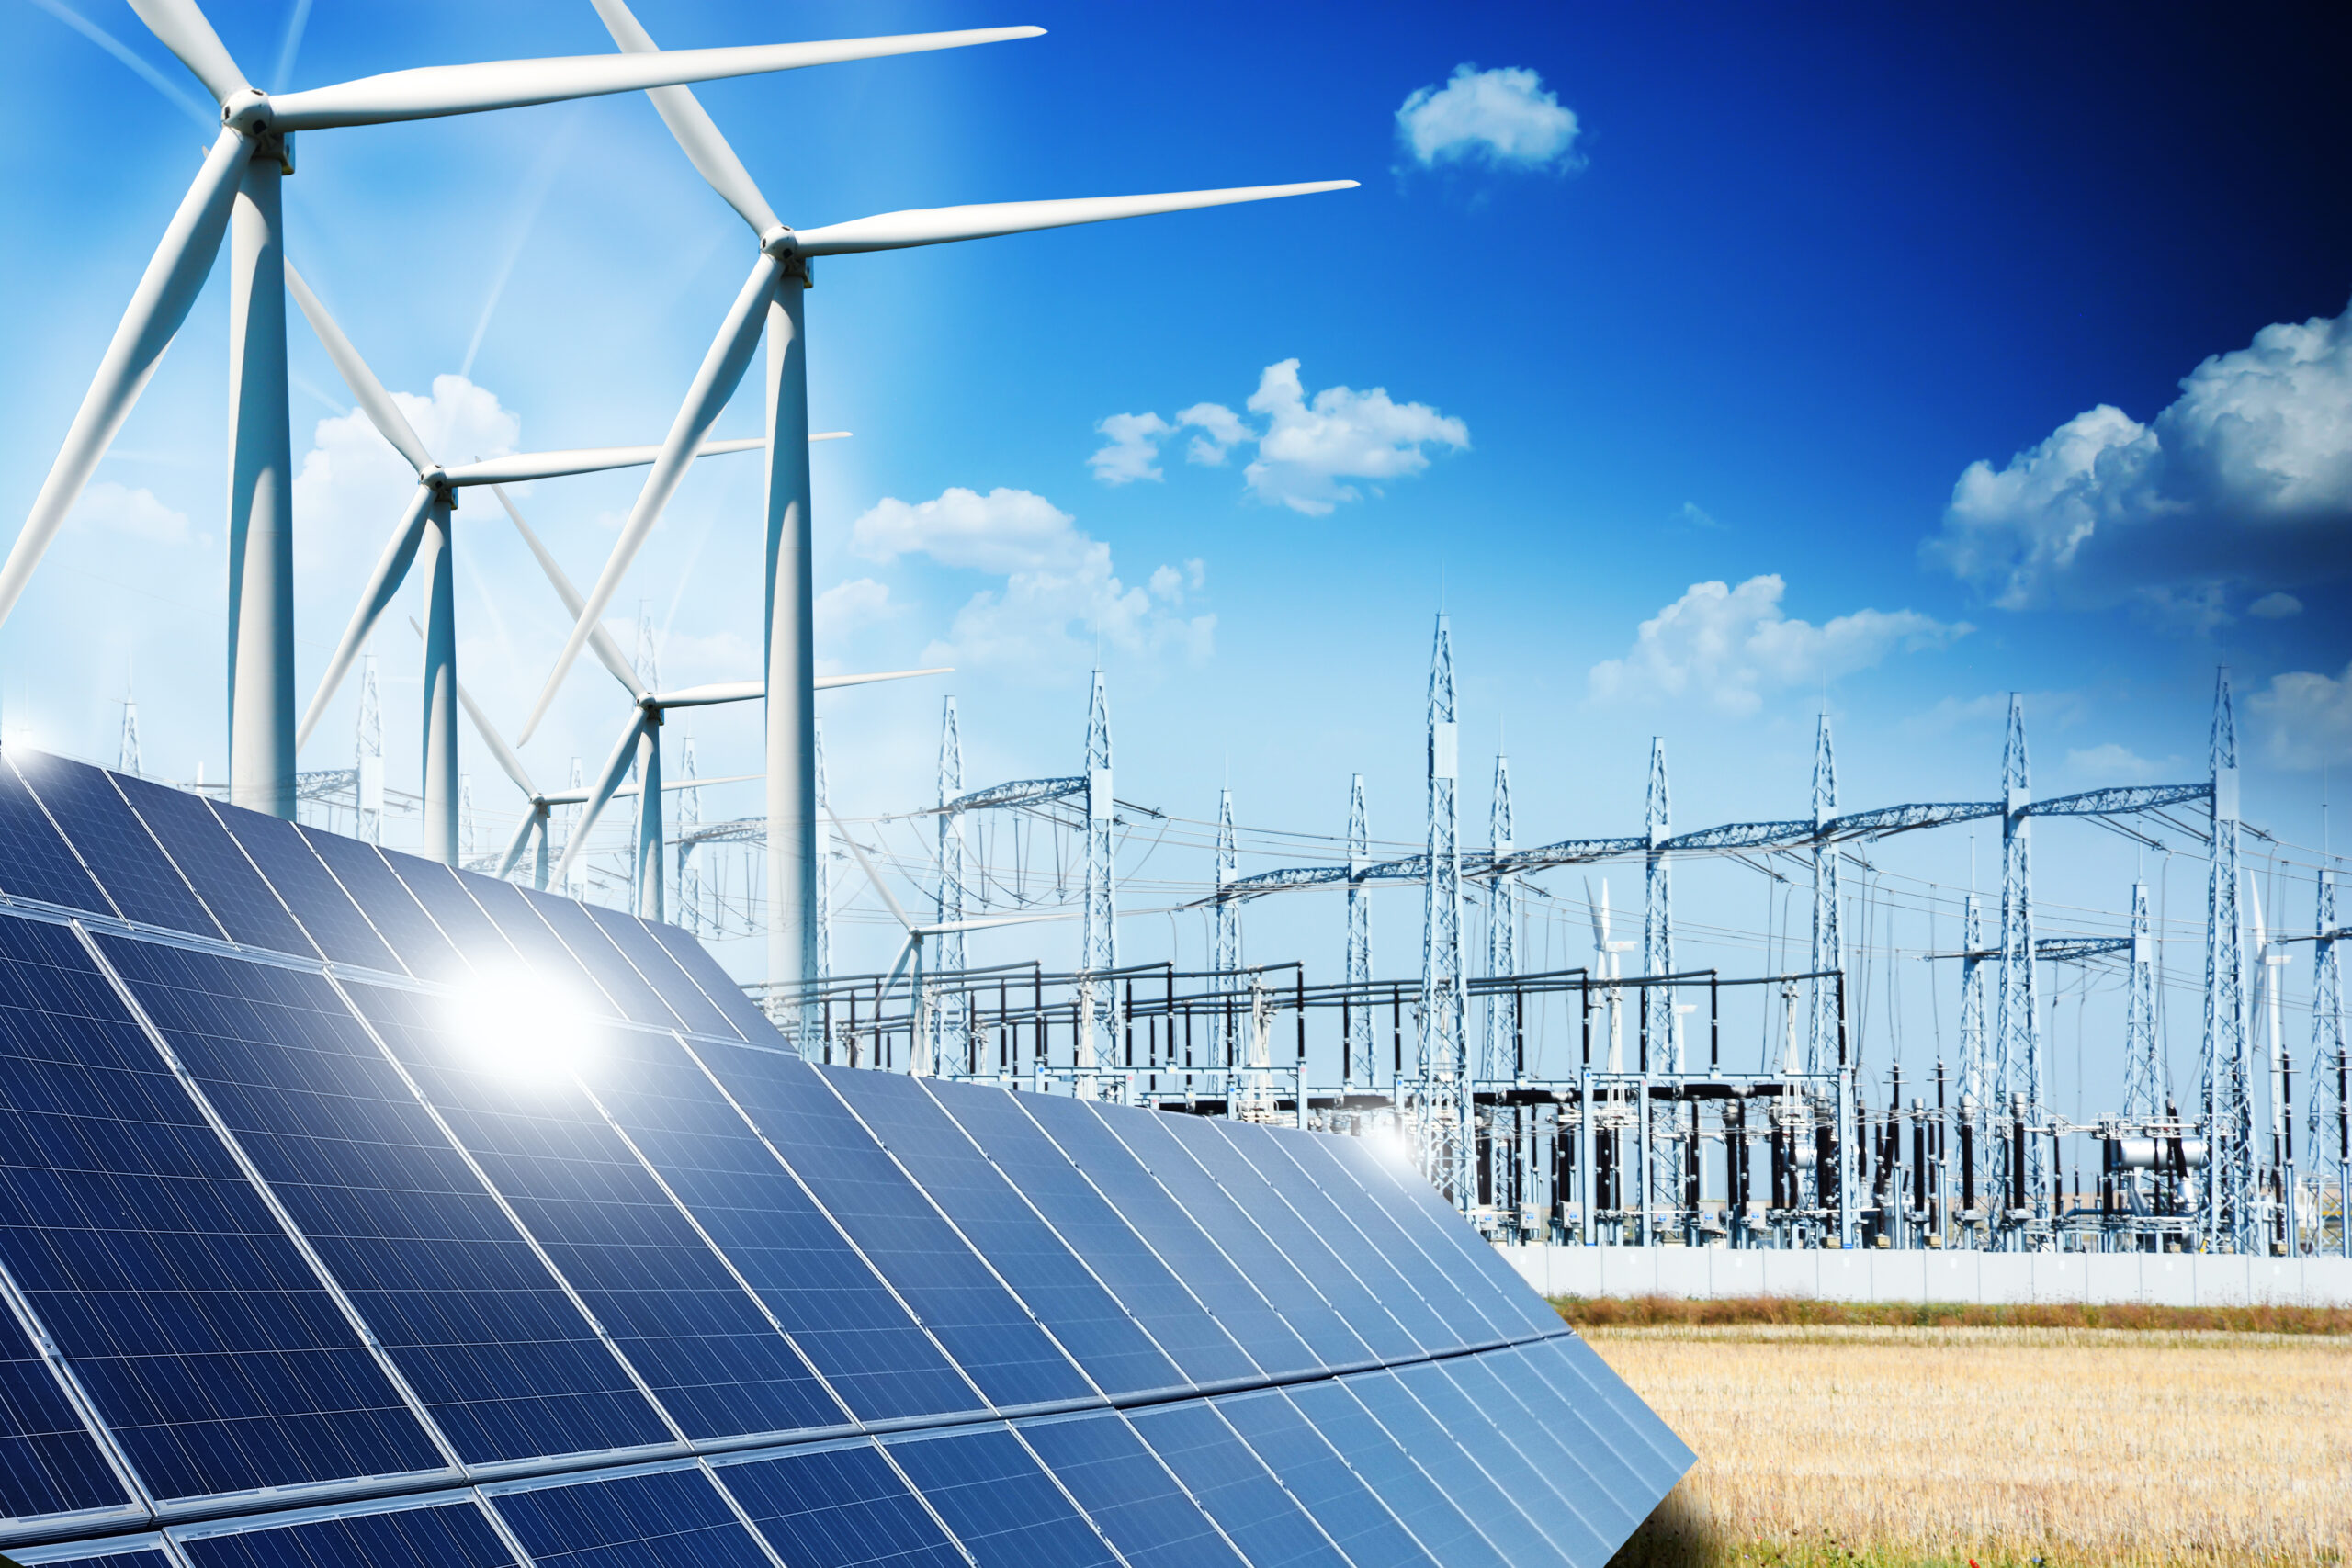 | Renewables image | Credit: eviart/Shutterstock.com |
 | Vestas image | Jeffrey Beall licenced uder CC |
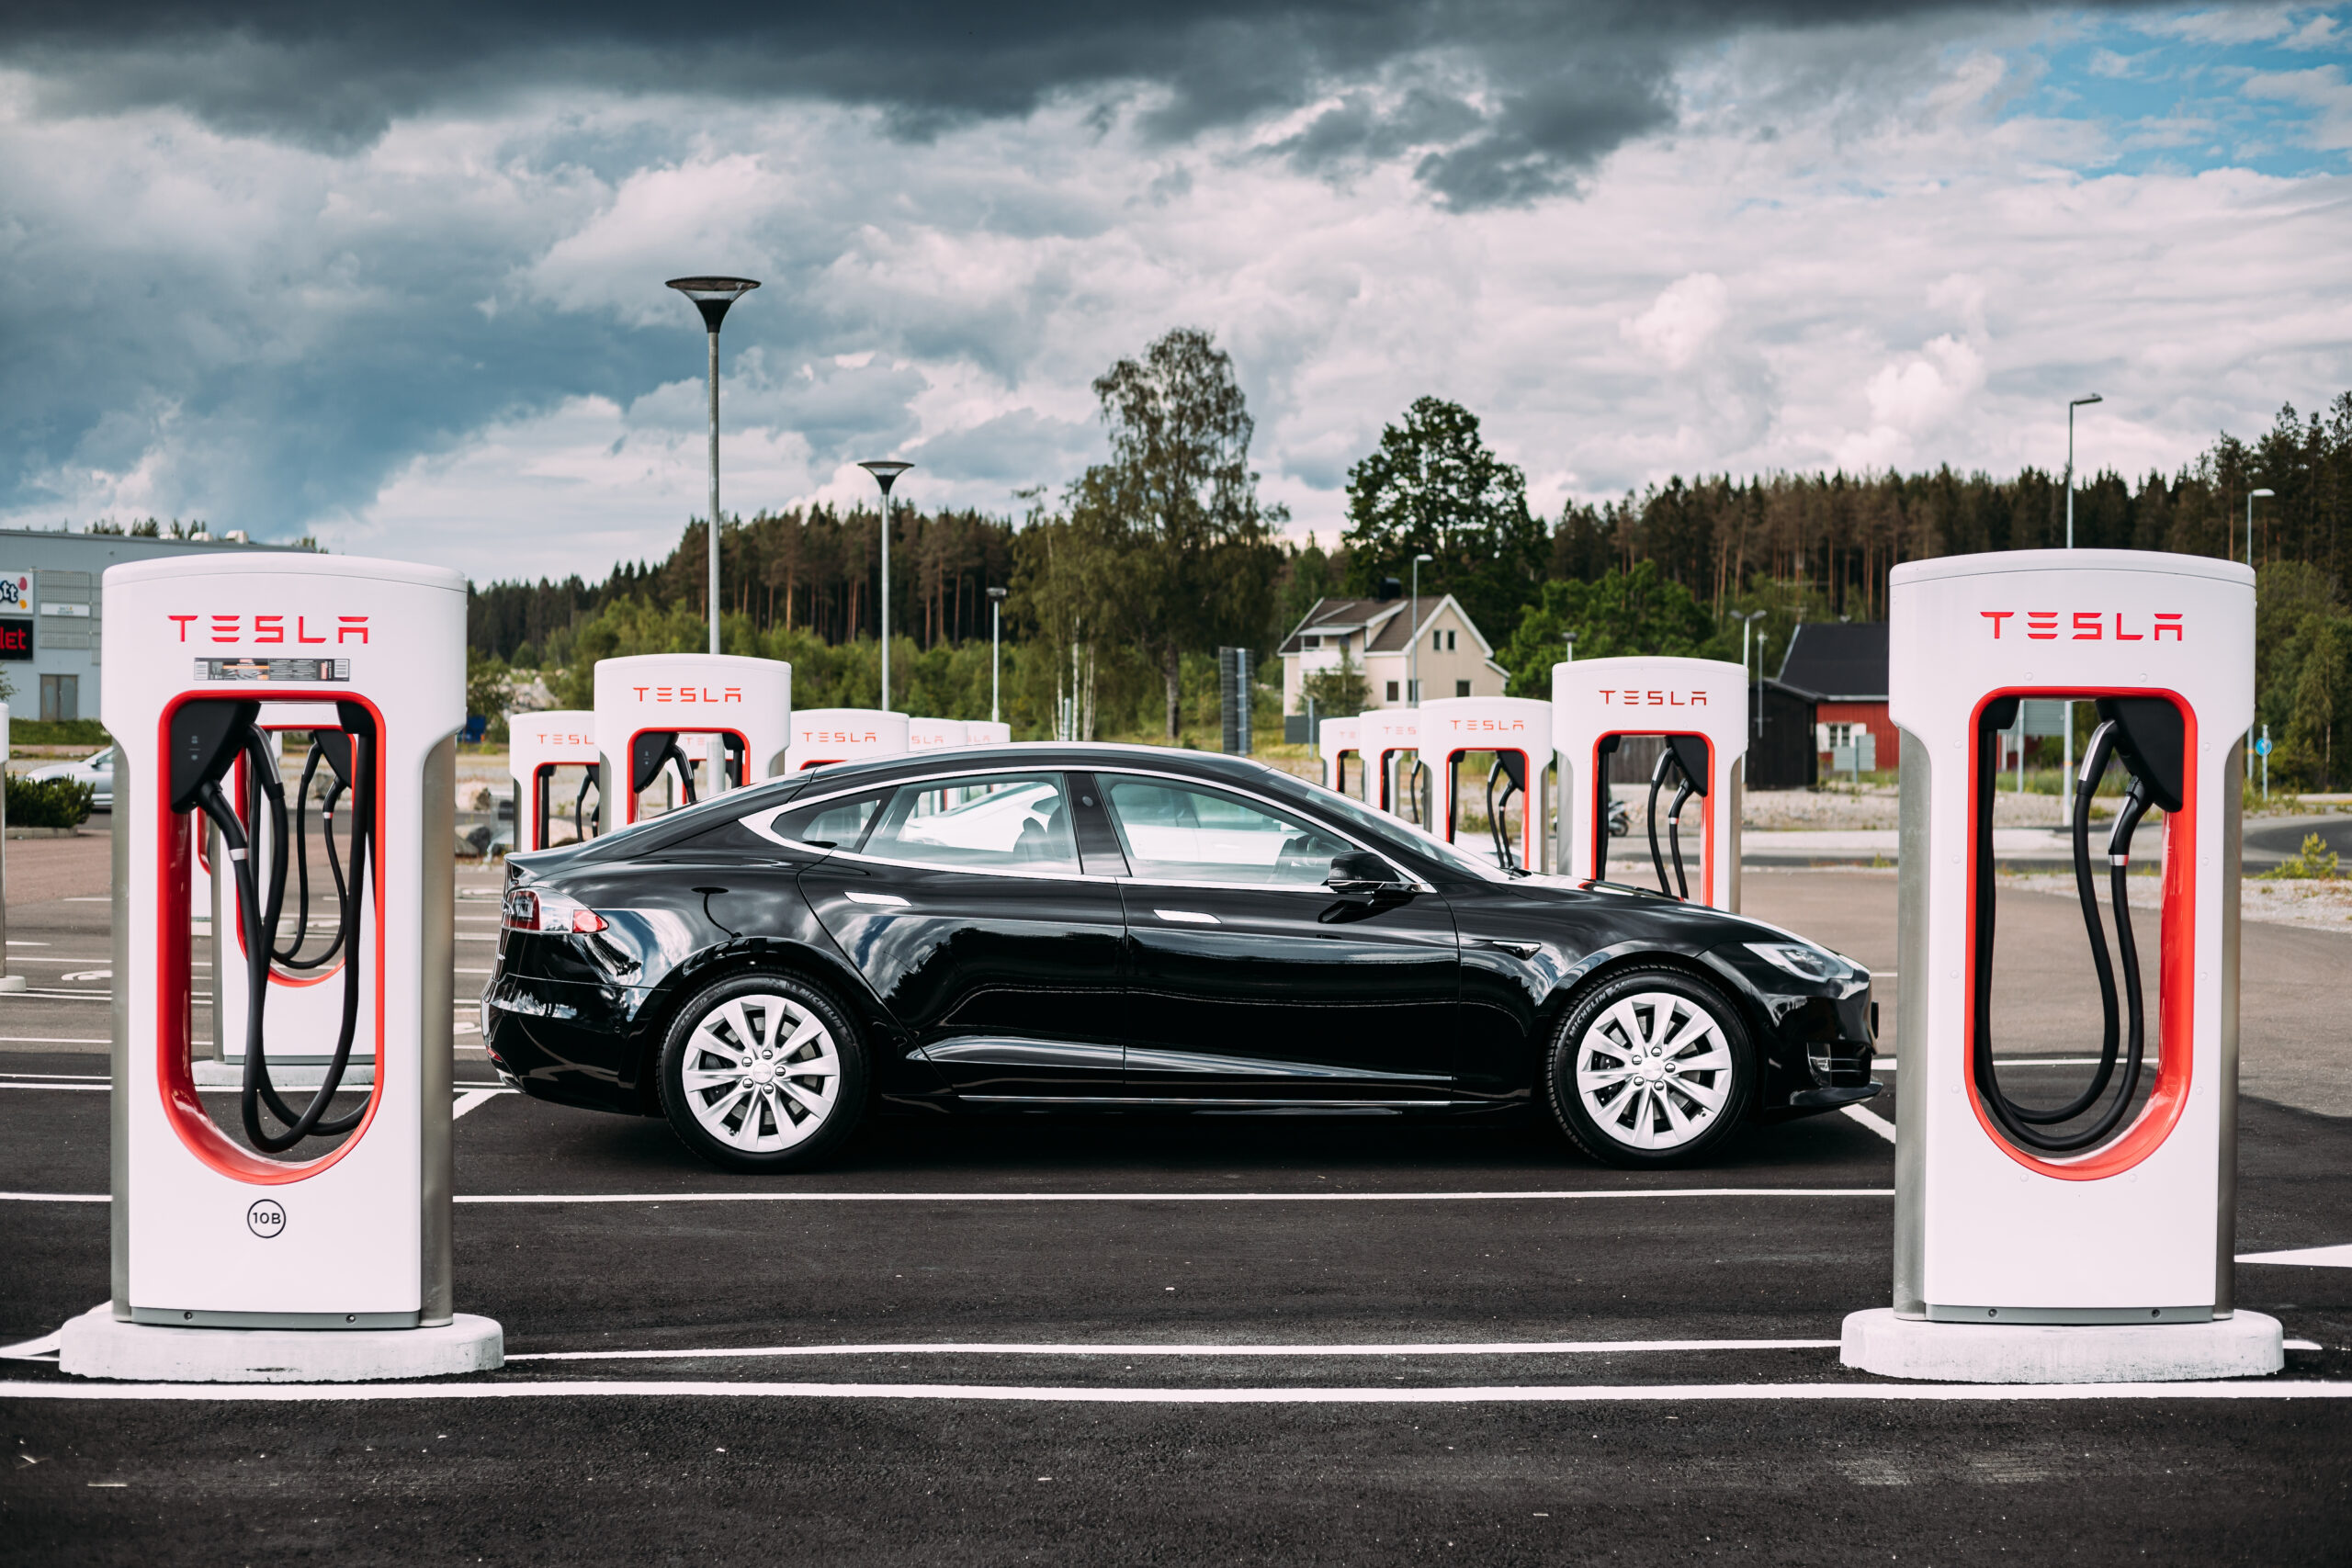 | Tesla image | Grisha Bruev/Shutterstock.com |