| Image | Title | Source / methodology |
 | Trump Digs Coal image | Credit: Evan El-Amin / Shutterstock.com |
 | Aeroplane image | Credit: fasttailwind/Shutterstock.com |
 | Apollo 11 image | NASA / licenced under CC |
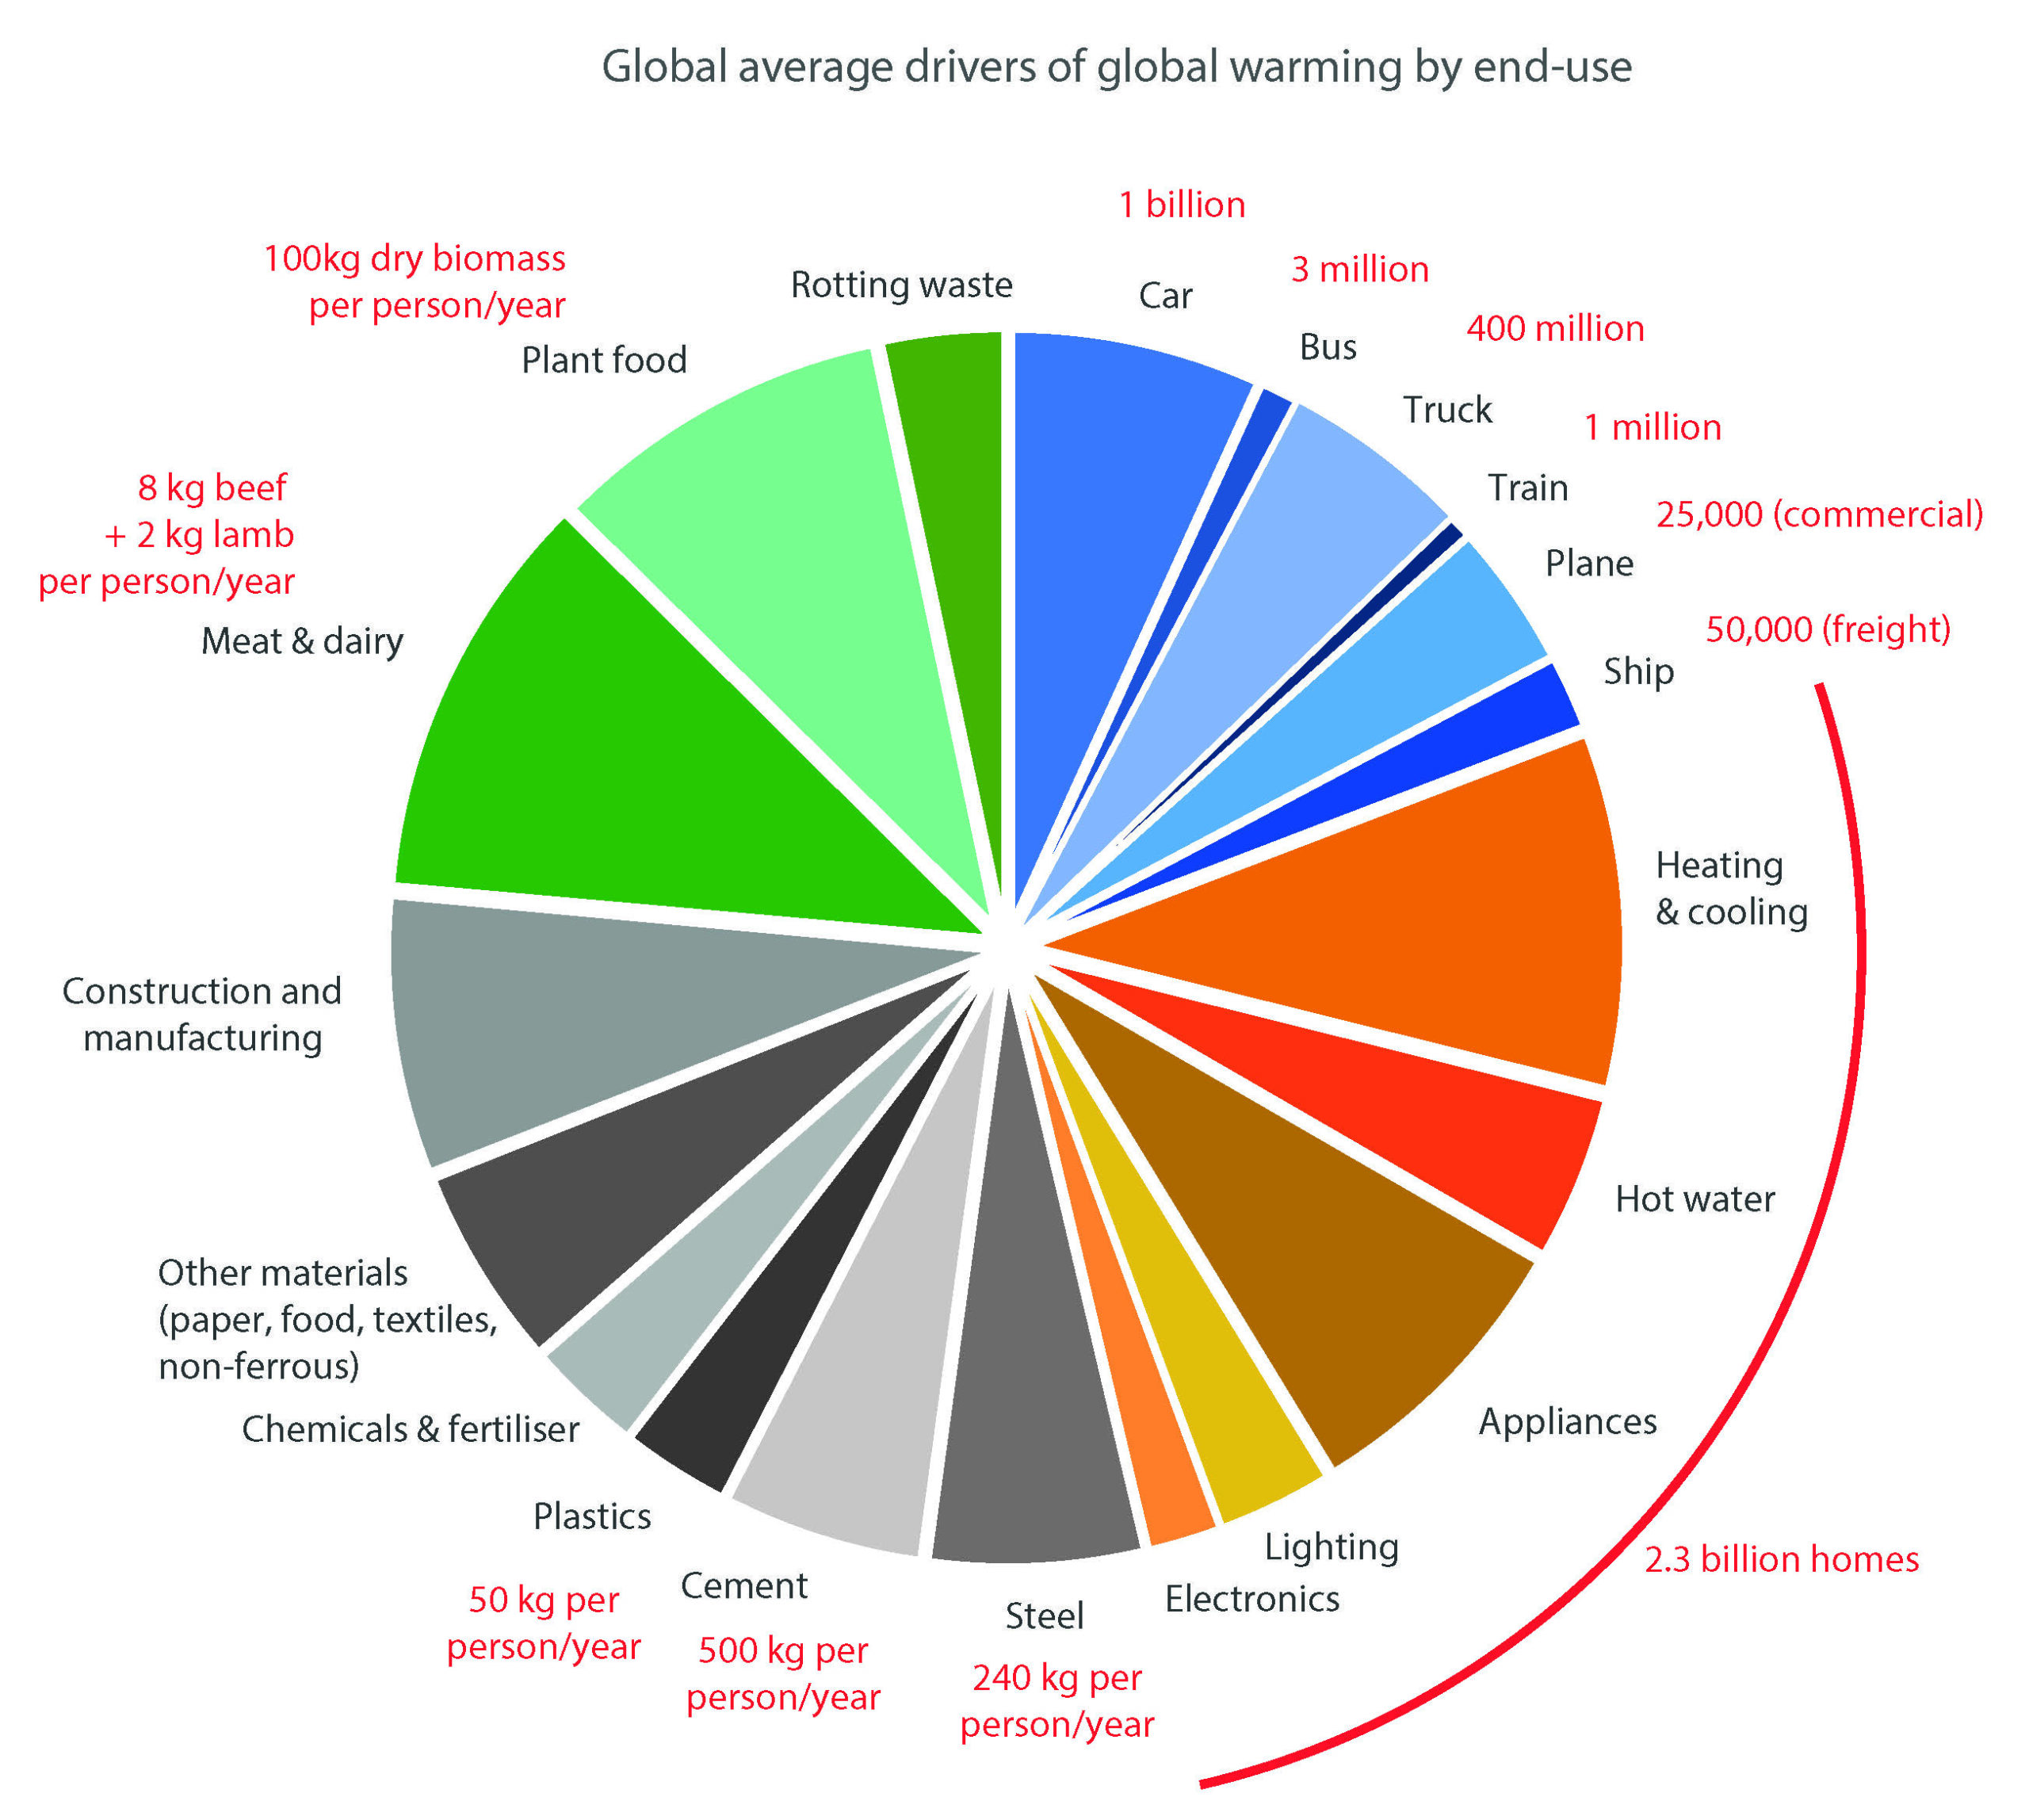 | Global GHG proportions | World Resources Institute 2020 – https://www.wri.org/data/world-greenhouse-gas-emissions-2018 |
 | Flying car image | Credit: Tinxi/Shutterstock.com |
 | Vertical forest | Credit: Ivan Kurmyshov/Shutterstock.com |
 | NETs image | Credit: Dmitry Kovalchuk/Shutterstock.com |
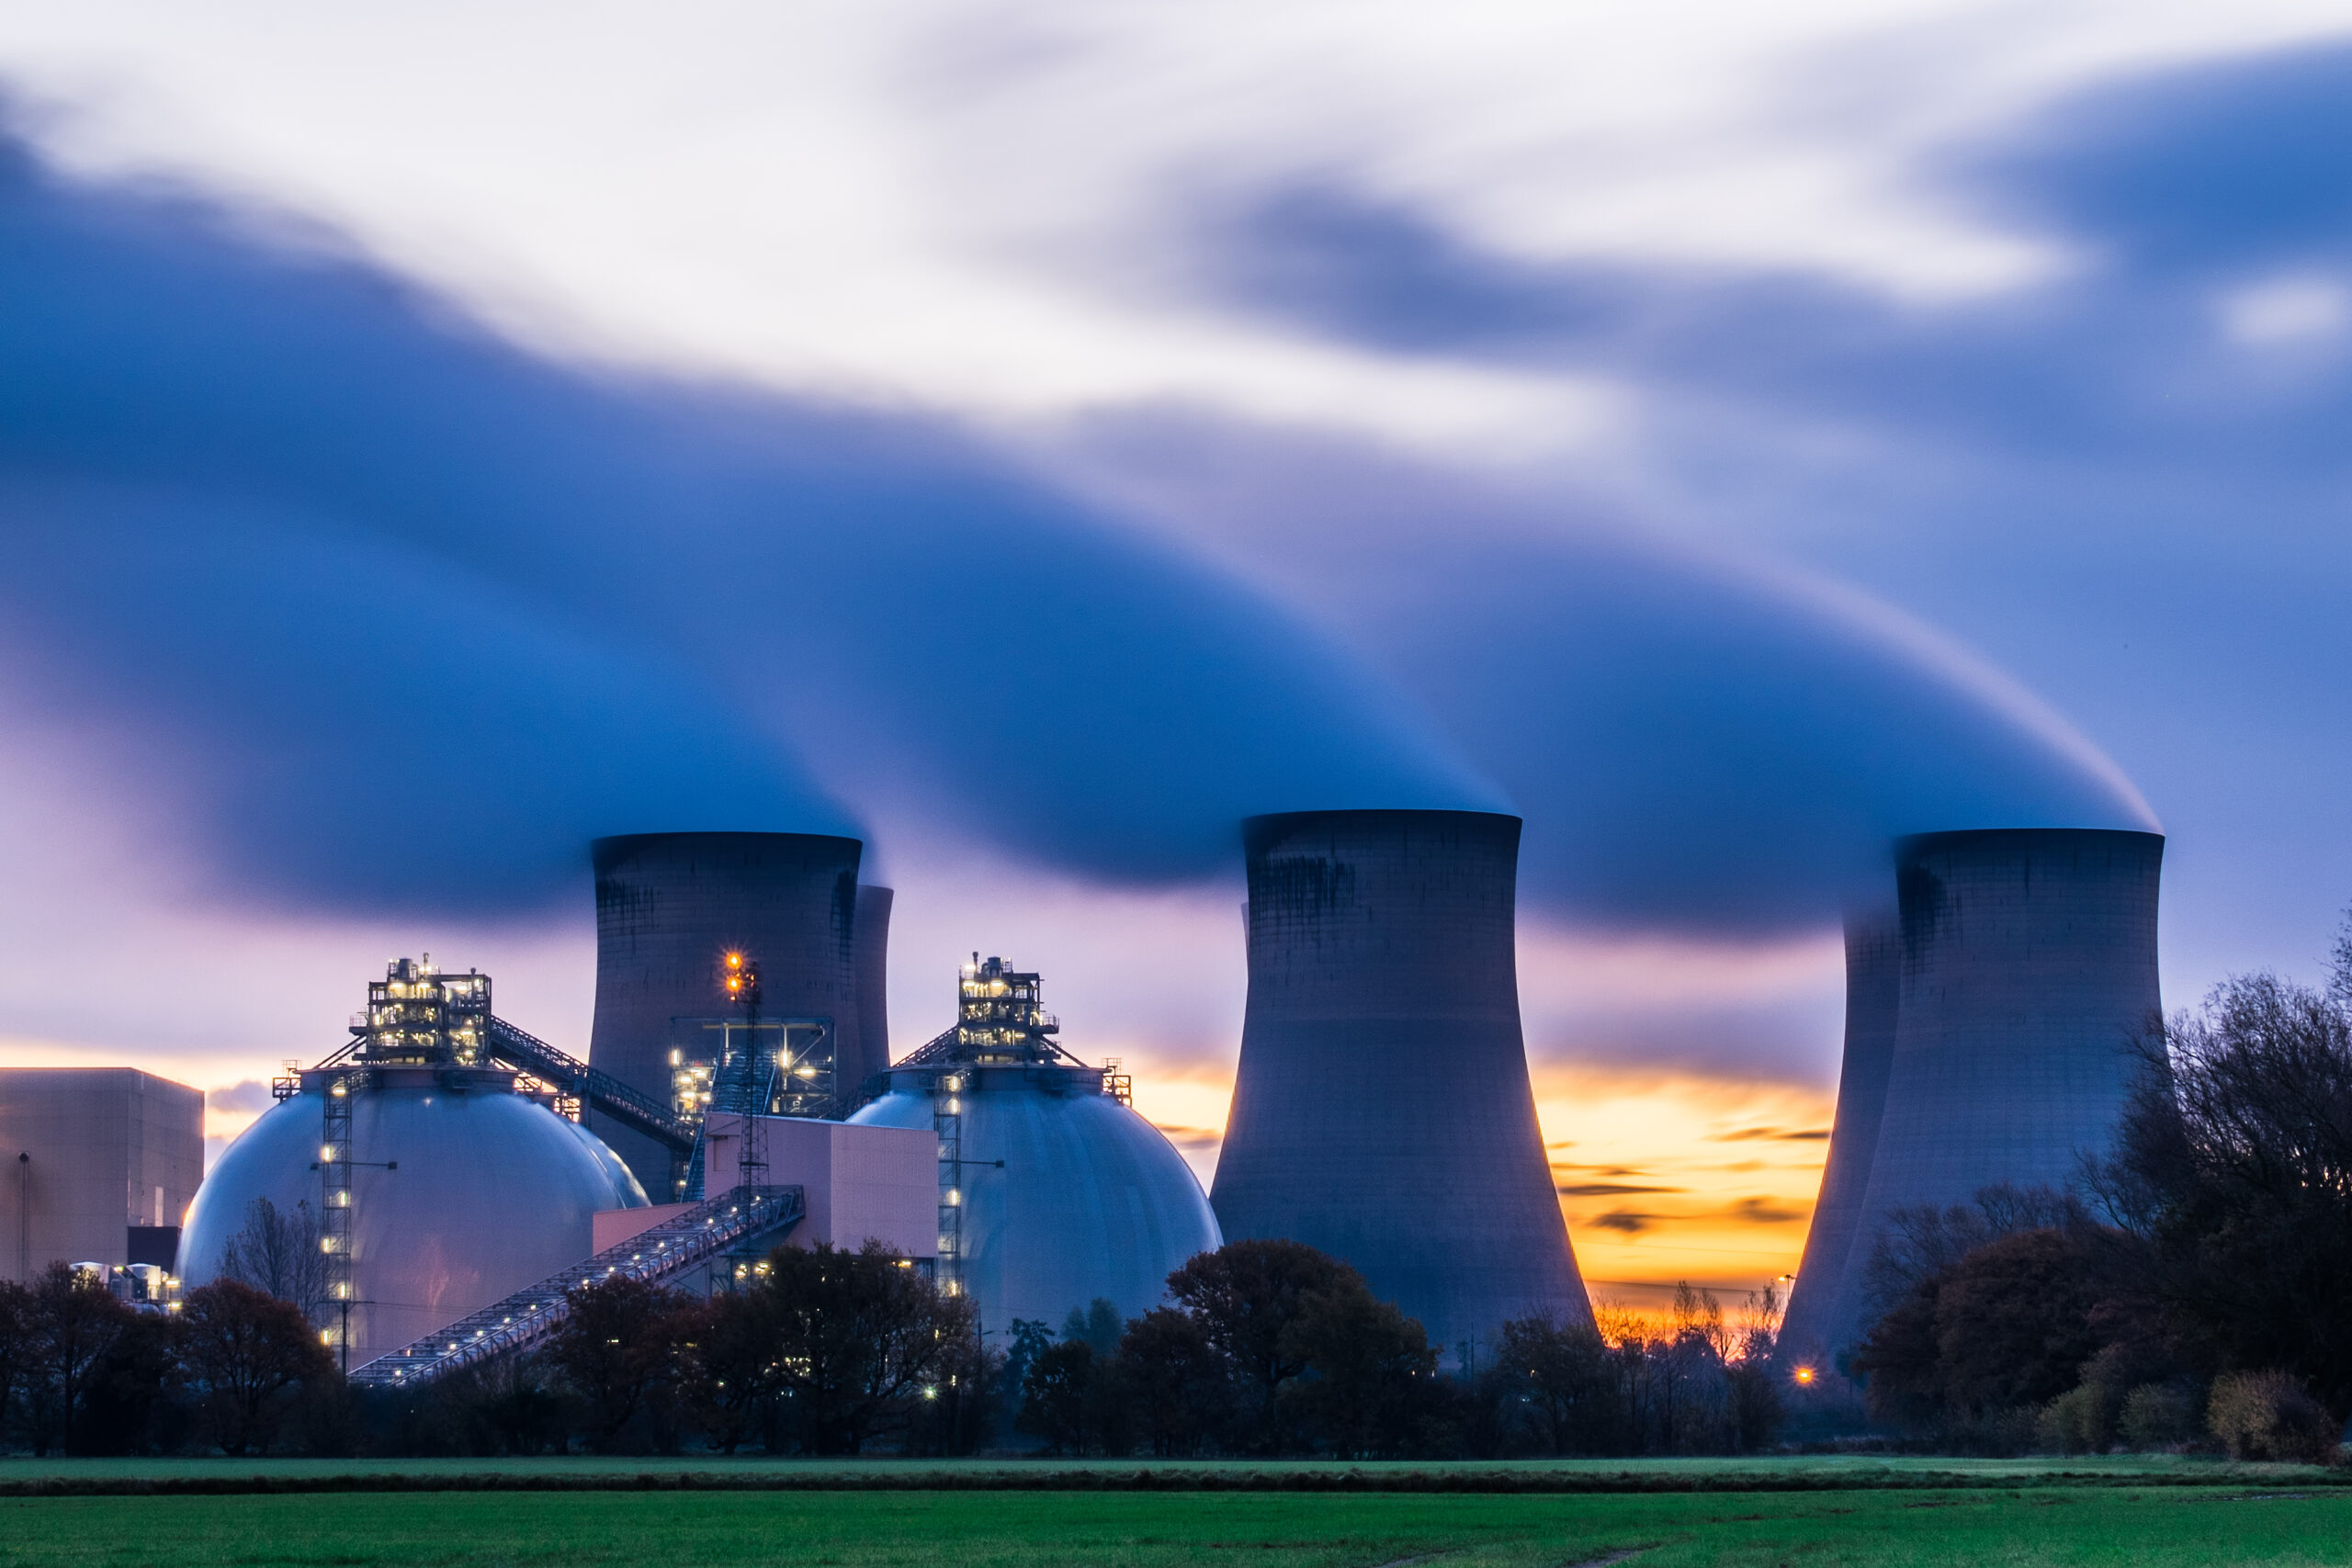 | DRAX image | Credit: Phil Silverman/Shutterstock.com |
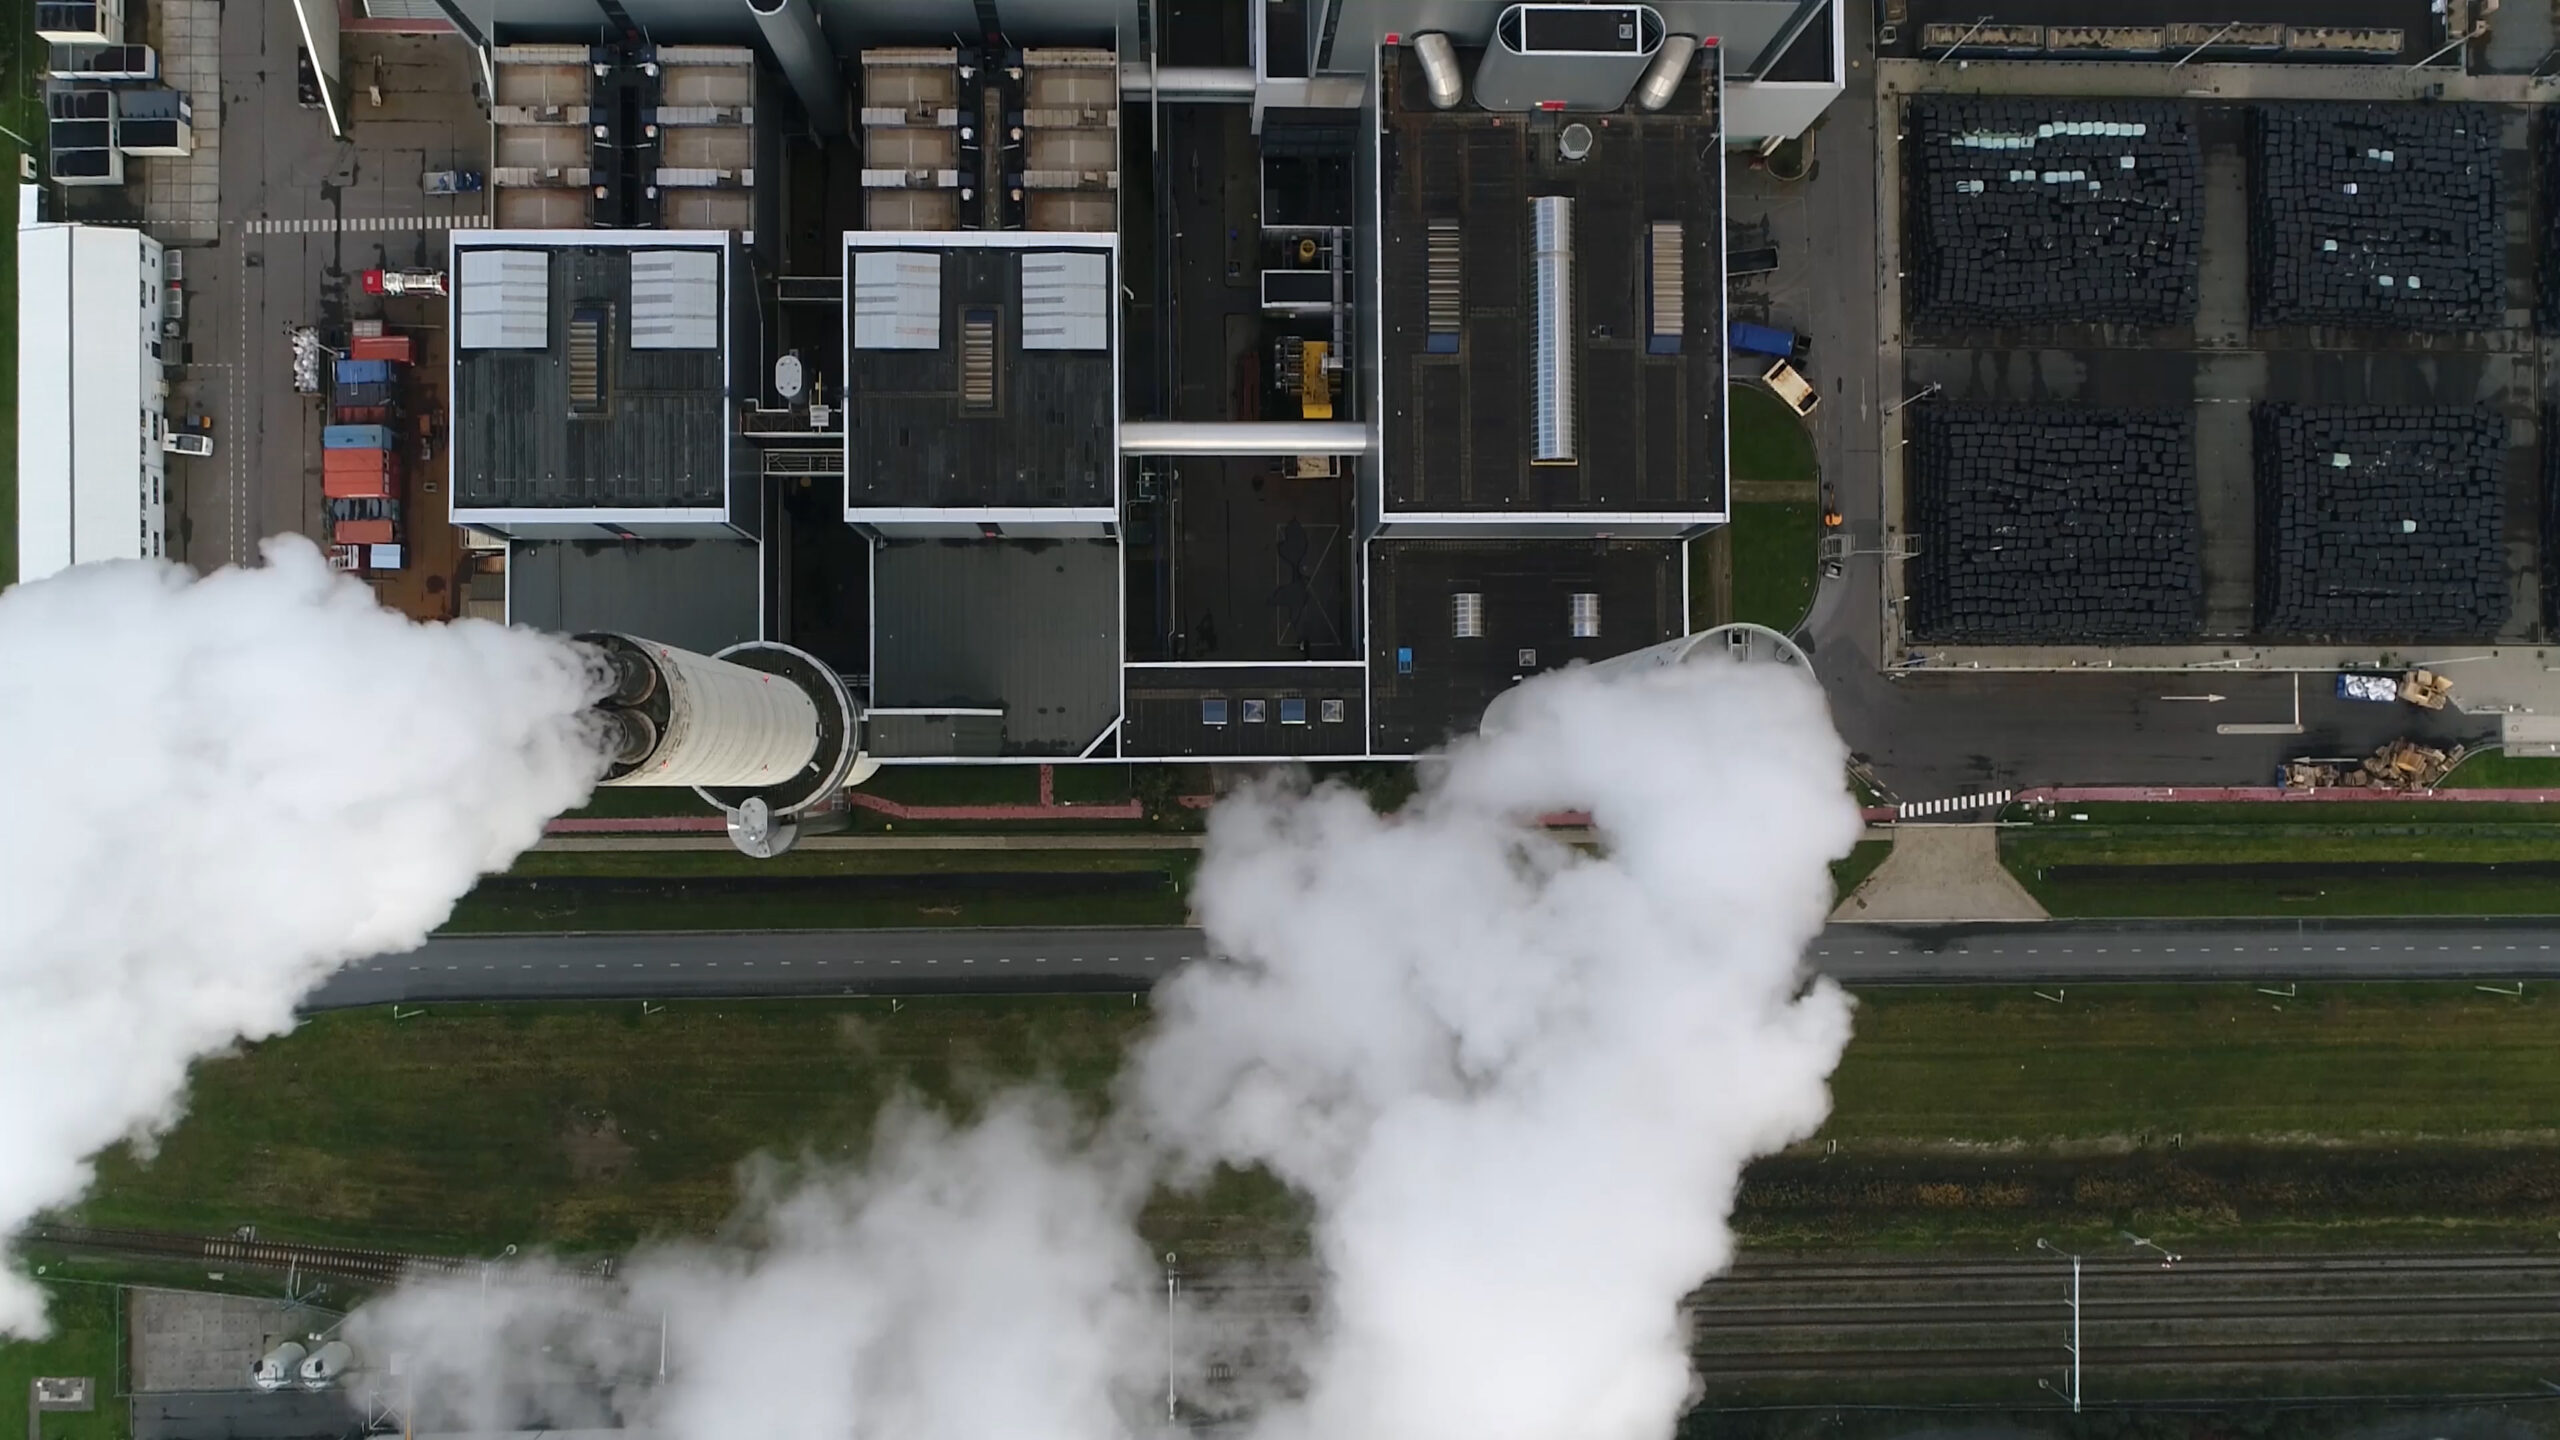 | Coal-fired power station | Credit: GLF Media/Shutterstock.com |
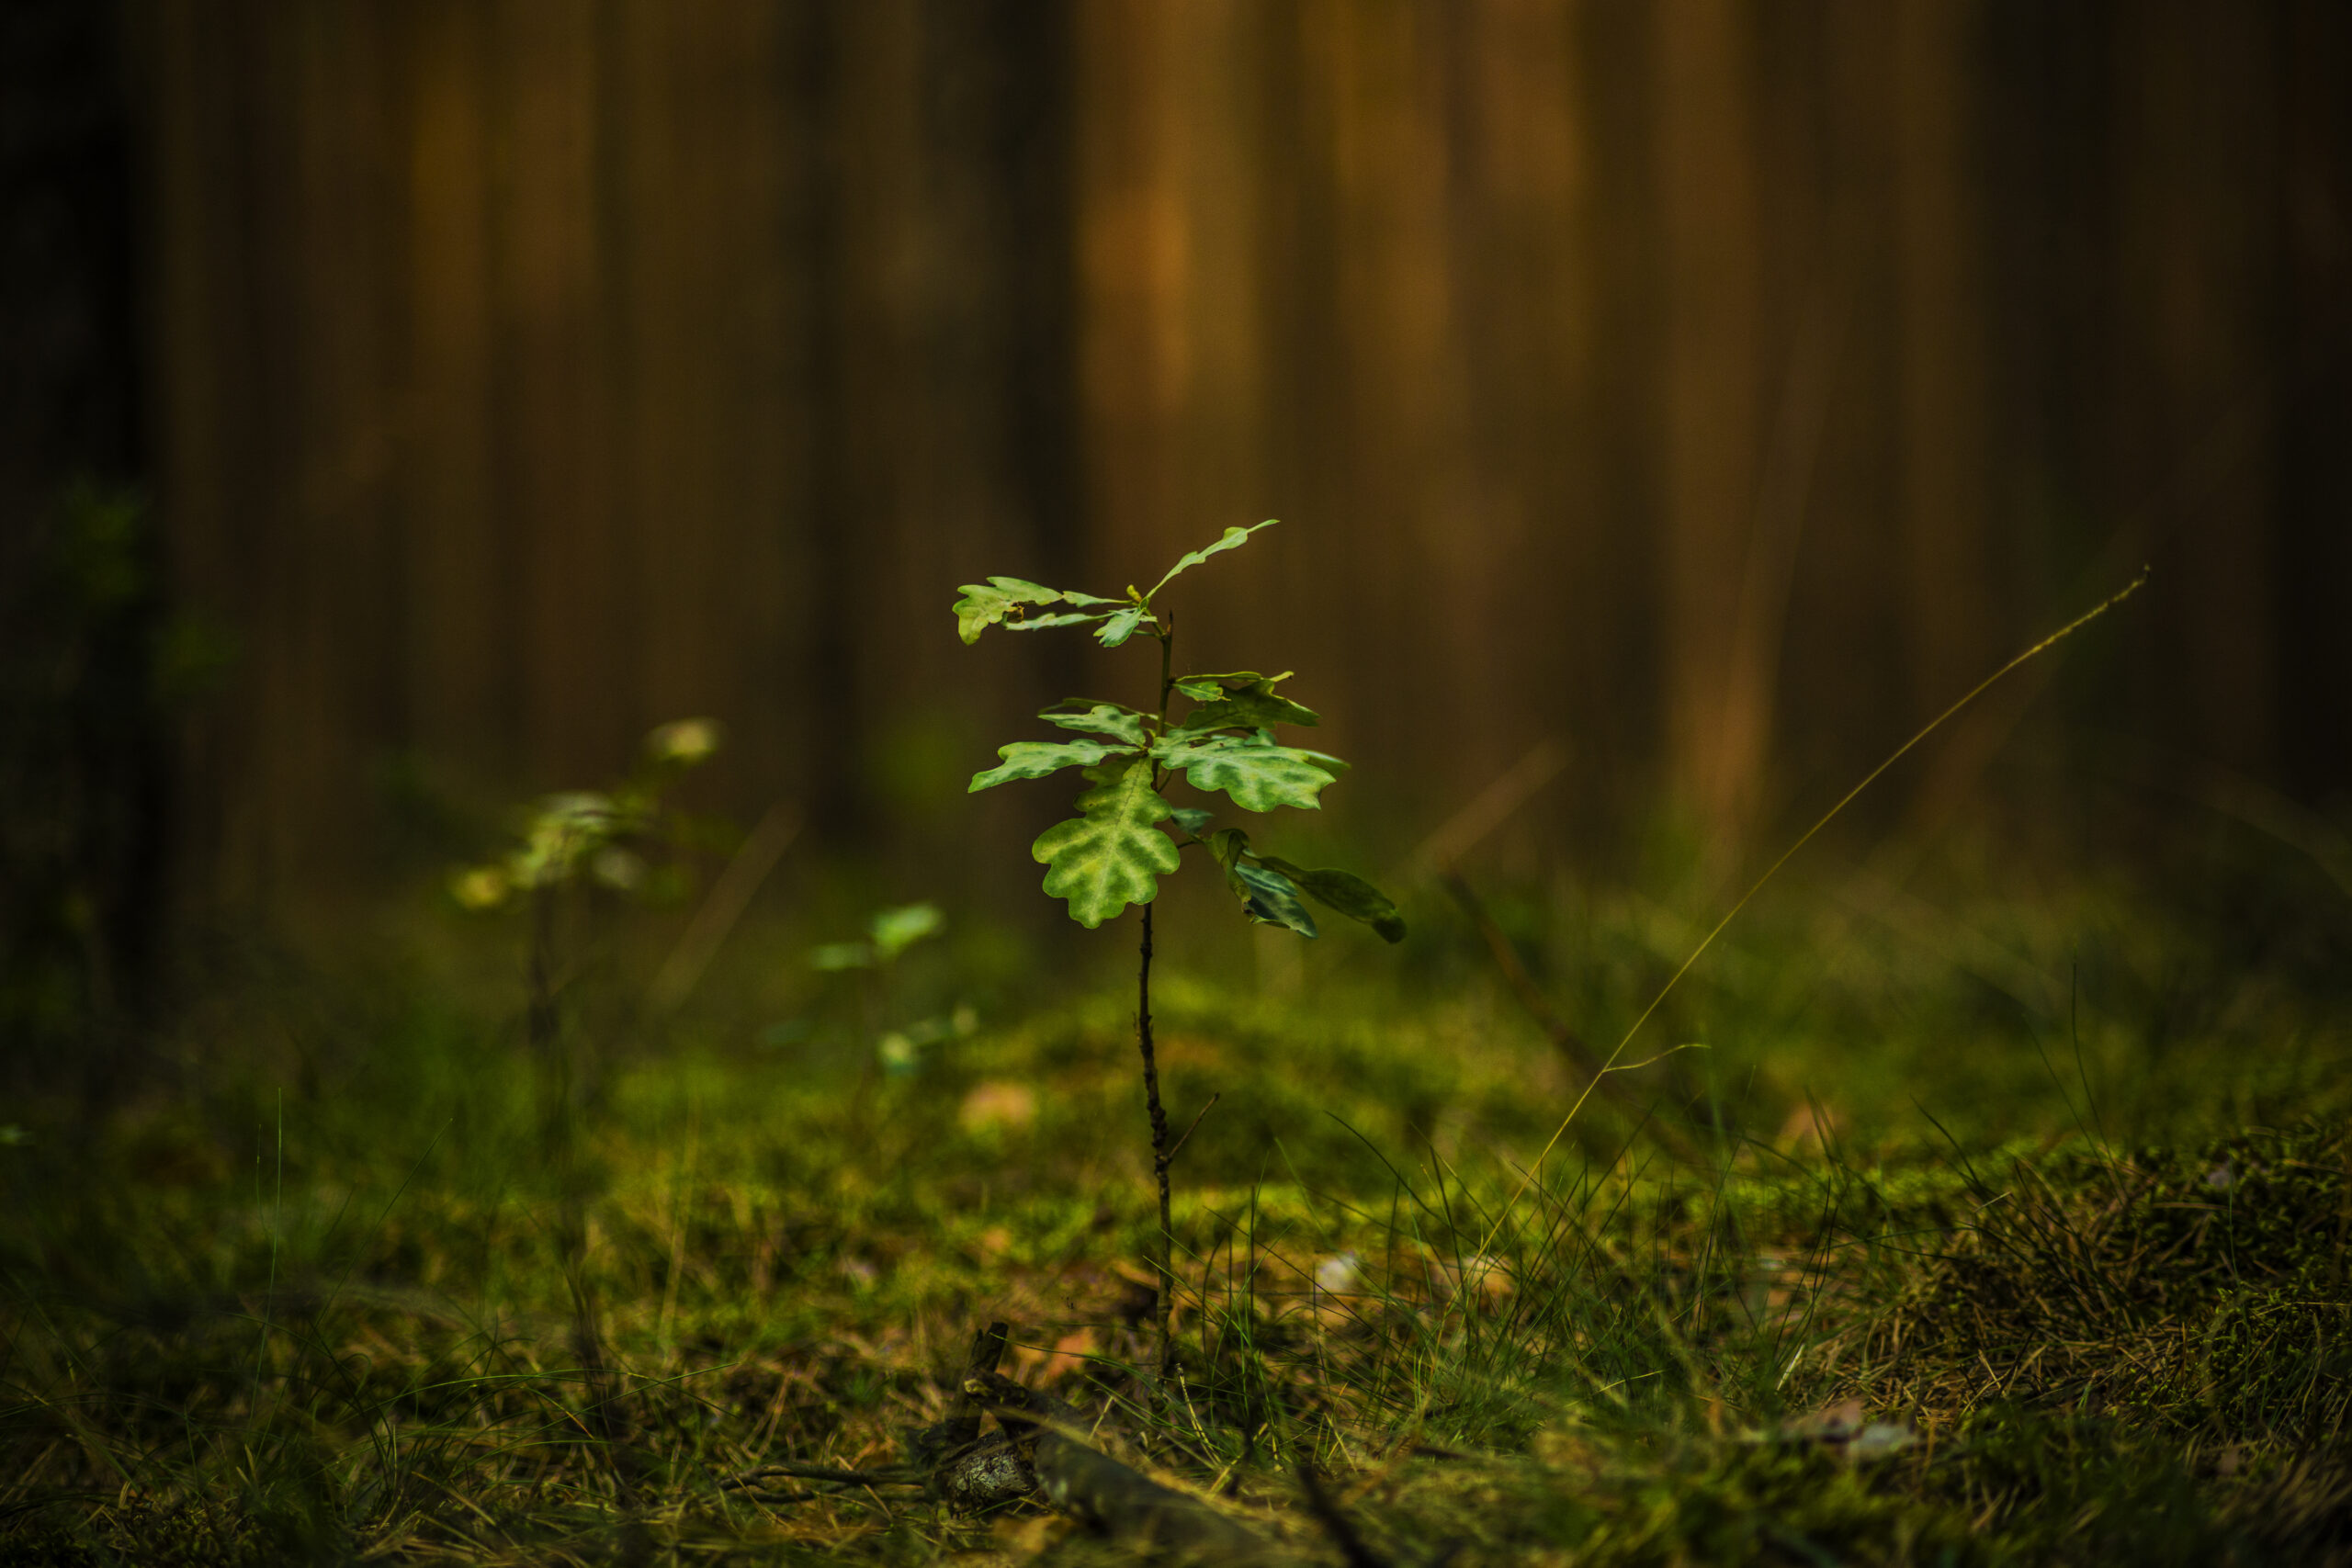 | Sapling image | Credit: Tino Lehmann/Shutterstock.com |
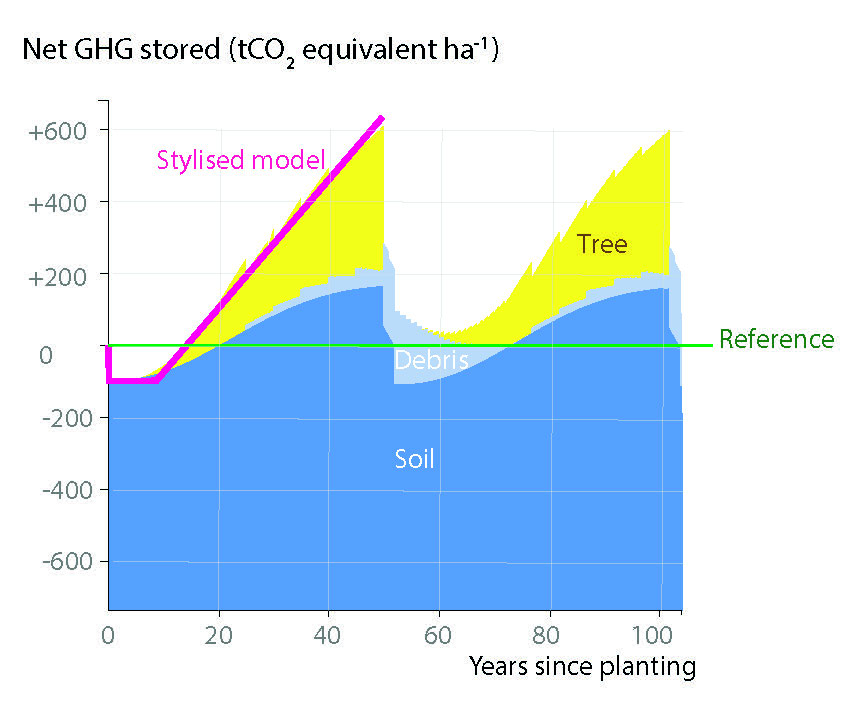
 | Tree growth | Time course of GHG balance of new Sitka spruce forest planted on previously arable land but with the capital emissions, Allwood, J., Offsetting supplementary information, data from Morison, J., Matthews, R., Miller, G., Perks, M., Randle, T., Vanguelova, E., White, M. and Yamulki, S. (2012). Understanding the carbon and greenhouse gas balance of forests in Britain. Forestry Commission Research Report. Forestry Commission, Edinburgh. i–vi + 1–149 pp. |
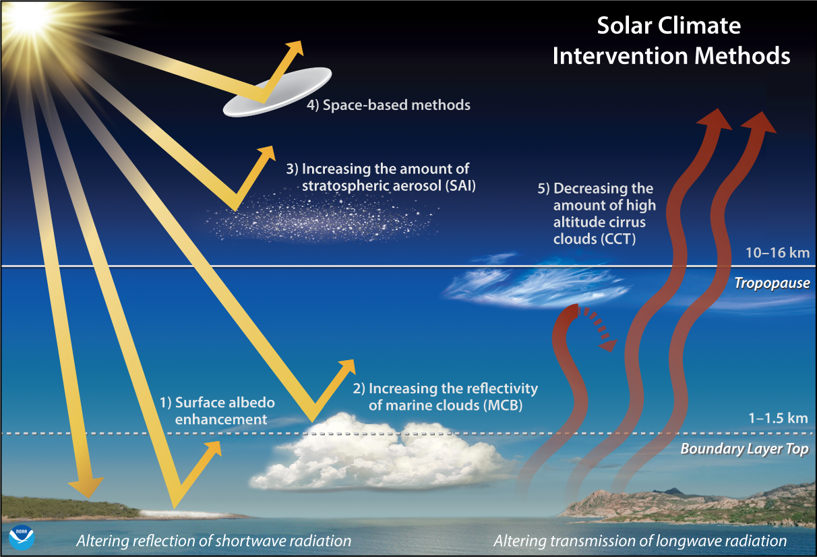 | Geoengineering | Credit: Chelsea Thompson, NOAA/CIRES NOAA – Simulated geoengineering evaluation: cooler planet, but with side effects |
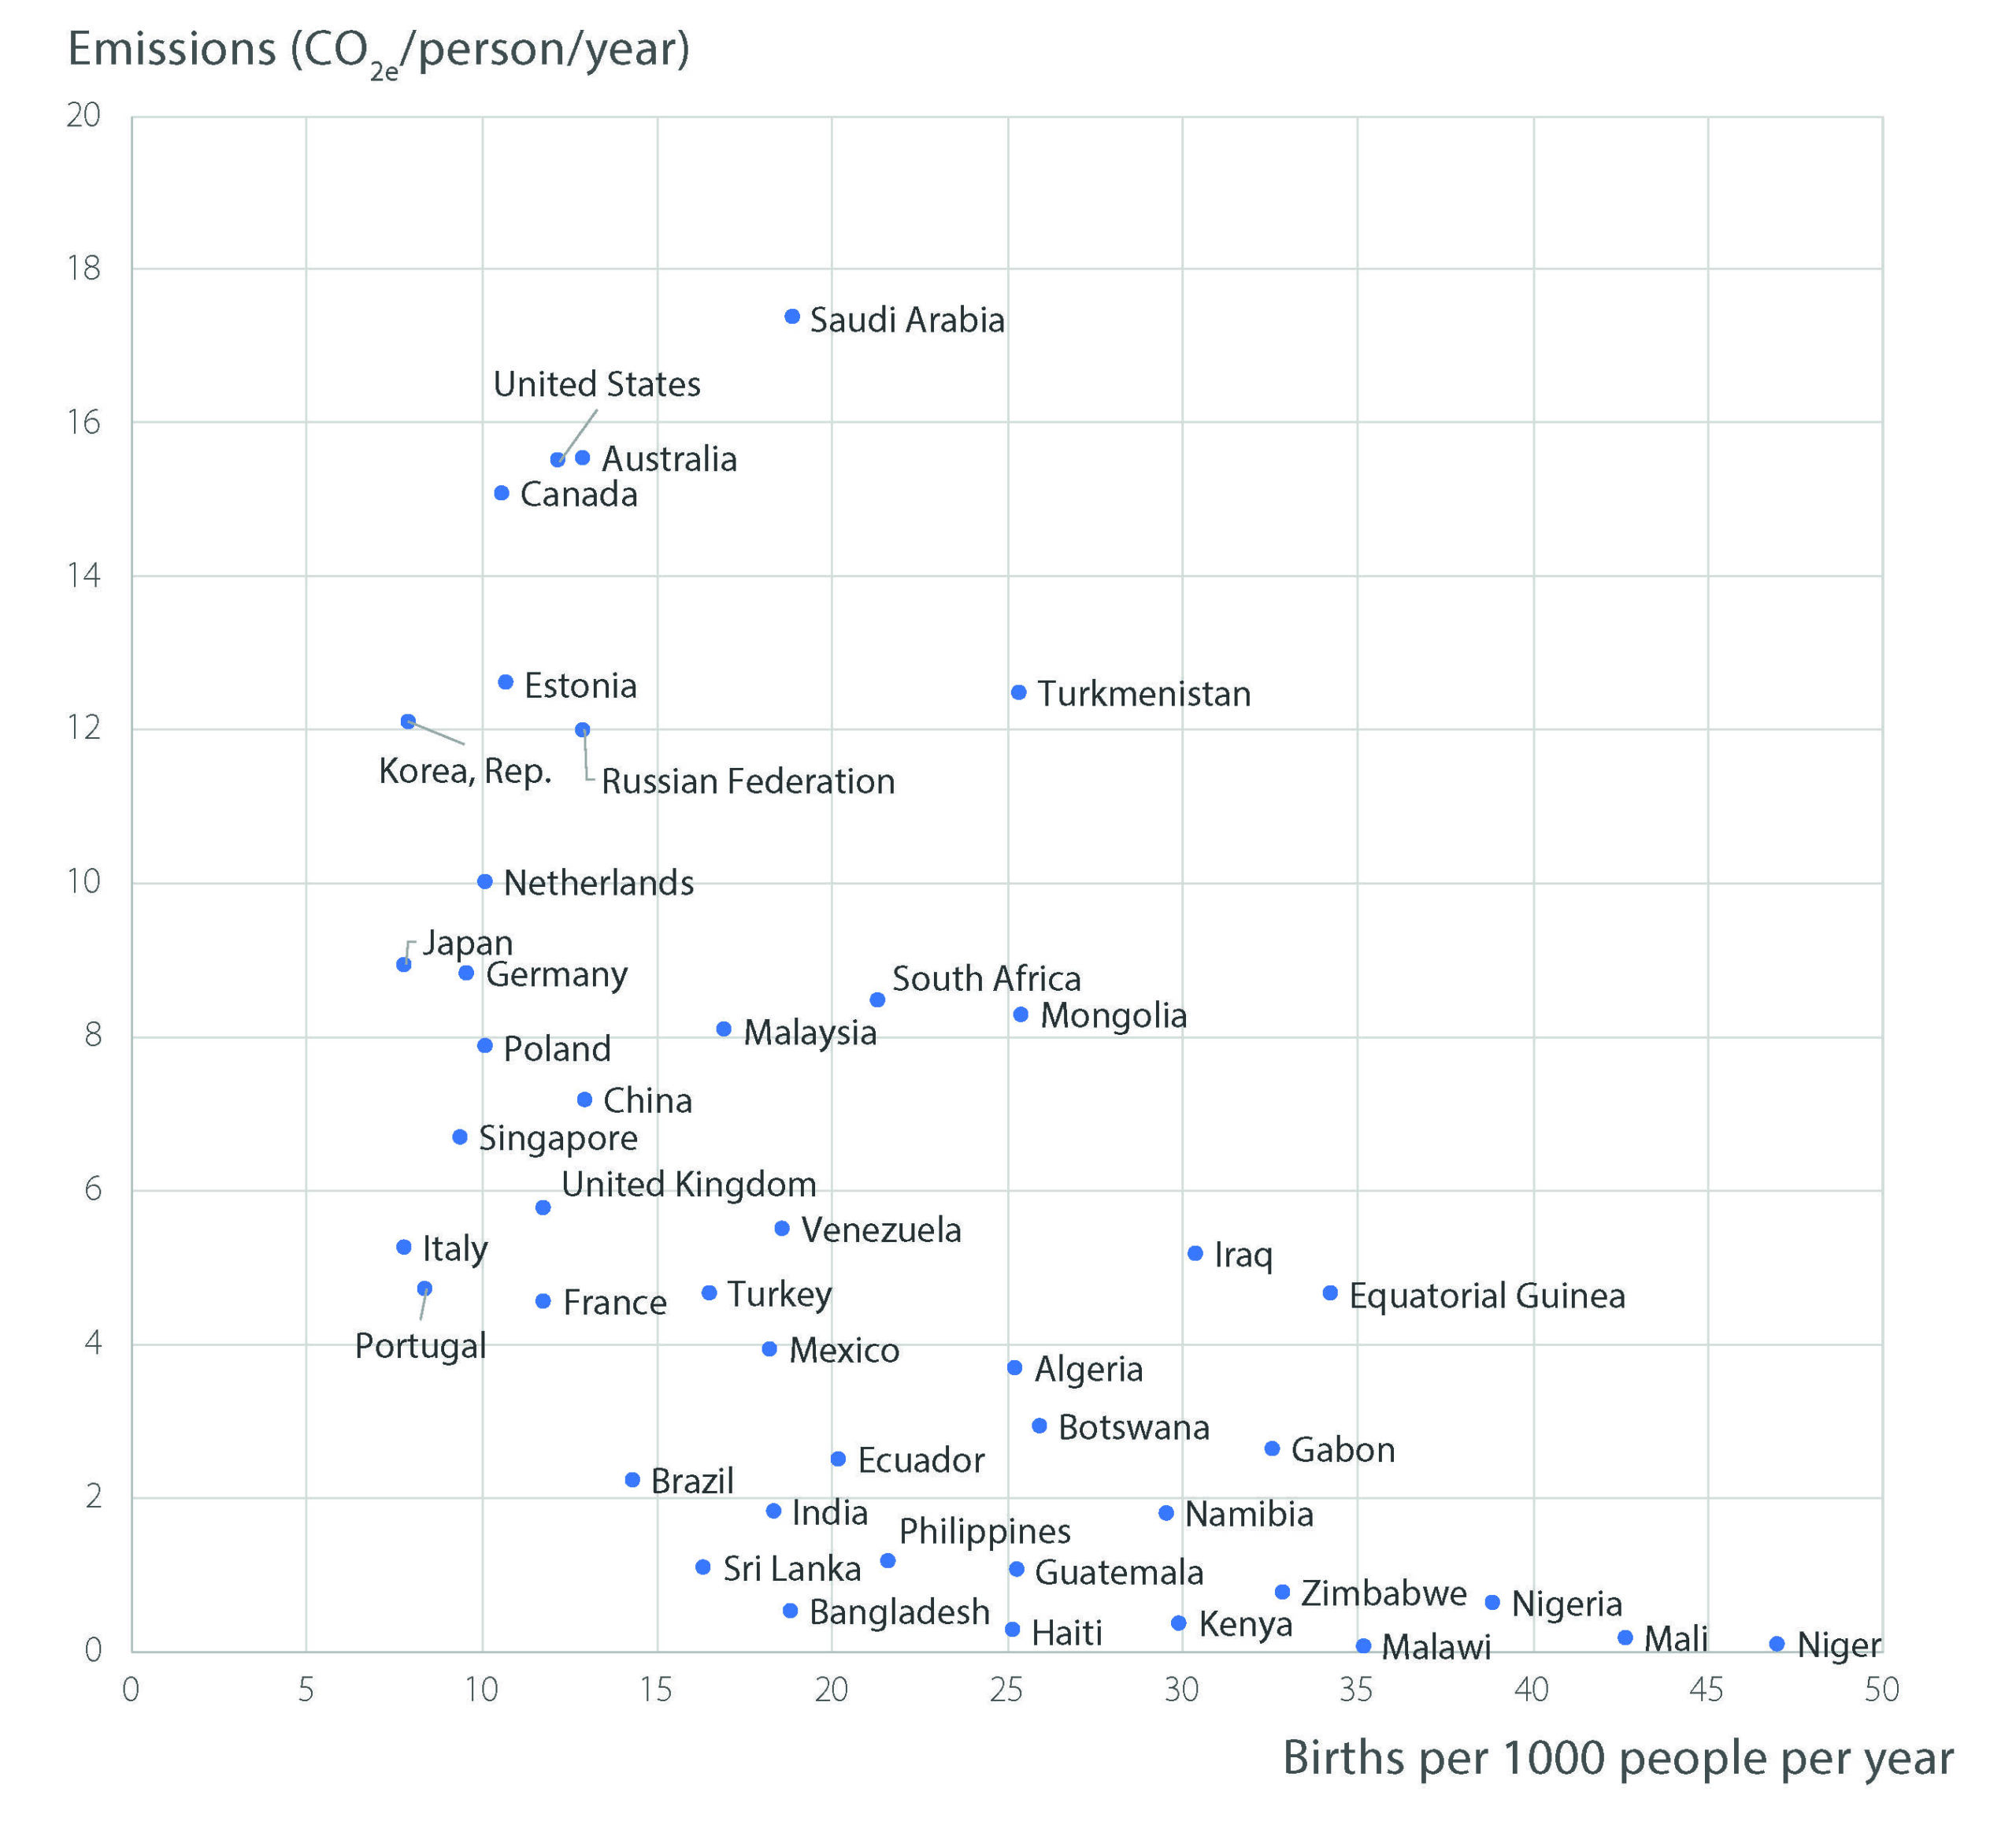 | Birthrates | The data used to create this figure is from the World Bank. The emissions figures are on a production basis, reflecting the industrial activities of each country, rather than the consumption basis which would be a better reflection of individual impact. However, following the current practices of the United Nations Framework Convention on Climate Change, the World Bank only has the production numbers. |
| | |